Regions Bank 2008 Annual Report Download - page 150
Download and view the complete annual report
Please find page 150 of the 2008 Regions Bank annual report below. You can navigate through the pages in the report by either clicking on the pages listed below, or by using the keyword search tool below to find specific information within the annual report.-
 1
1 -
2
-
3
-
4
-
5
-
6
-
7
-
8
-
9
-
10
-
11
-
12
-
13
-
14
-
15
-
16
-
17
-
18
-
19
-
20
-
21
-
22
-
23
-
24
-
25
-
26
-
27
-
28
-
29
-
30
-
31
-
32
-
33
-
34
-
35
-
36
-
37
-
38
-
39
-
40
-
41
-
42
-
43
-
44
-
45
-
46
-
47
-
48
-
49
-
50
-
51
-
52
-
53
-
54
-
55
-
56
-
57
-
58
-
59
-
60
-
61
-
62
-
63
-
64
-
65
-
66
-
67
-
68
-
69
-
70
-
71
-
72
-
73
-
74
-
75
-
76
-
77
-
78
-
79
-
80
-
81
-
82
-
83
-
84
-
85
-
86
-
87
-
88
-
89
-
90
-
91
-
92
-
93
-
94
-
95
-
96
-
97
-
98
-
99
-
100
-
101
-
102
-
103
-
104
-
105
-
106
-
107
-
108
-
109
-
110
-
111
-
112
-
113
-
114
-
115
-
116
-
117
-
118
-
119
-
120
-
121
-
122
-
123
-
124
-
125
-
126
-
127
-
128
-
129
-
130
-
131
-
132
-
133
-
134
-
135
-
136
-
137
-
138
-
139
-
 140
140 -
 141
141 -
 142
142 -
 143
143 -
 144
144 -
 145
145 -
 146
146 -
 147
147 -
 148
148 -
 149
149 -
 150
150 -
 151
151 -
 152
152 -
 153
153 -
 154
154 -
 155
155 -
 156
156 -
 157
157 -
 158
158 -
 159
159 -
 160
160 -
161
-
162
-
163
-
164
-
165
-
166
-
167
-
168
-
169
-
170
-
171
-
172
-
173
-
174
-
175
-
176
-
177
-
178
-
179
-
180
-
181
-
182
-
183
-
184
 |
 |

2007
Notional
Amount
Fair
Value
Hedged
Item
Weighted-
Average
Maturity
Pay
Structure
(Dollars in millions)
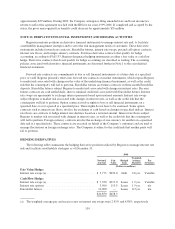
Fair Value Hedges
Forward sale commitments ................. $ 905 $ (4.5) Loans Held for Sale 0.1 yrs. n/a
Interest rate swaps (a) ...................... 3,125 122.4 Debt 4.0 yrs. Variable
$4,030 $117.9
Cash Flow Hedges
Interest rate swaps (a) ...................... $3,960 $133.1 Loans 2.6 yrs. Variable
Interest rate options ....................... 2,000 41.5 Loans 1.6 yrs. n/a
$5,960 $174.6
(a) The weighted-average pay and receive rates on interest rate swaps were 5.76% and 6.05%, respectively.
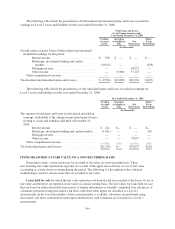
The ineffectiveness recognized on both fair value hedges and cash flow hedges was immaterial for years
ending December 31, 2008, 2007 and 2006.
Regions reported an after-tax gain of $25.8 million and an after-tax loss of $1.7 million in other
comprehensive income at December 31, 2008, and 2007, respectively, related to terminated cash flow hedges of
loan and debt instruments which will be amortized into earnings in conjunction with the recognition of interest
payments through 2011. Regions recognized pre-tax income of $10.7 million during 2008 related to this
amortization. During 2009, Regions expects to reclassify out of other comprehensive income and into earnings
approximately $272.9 million in pre-tax income due to the receipt of interest payments on all cash flow hedges.
Of this amount, $30.9 million relates to the amortization of discontinued cash flow hedges.
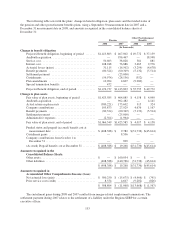
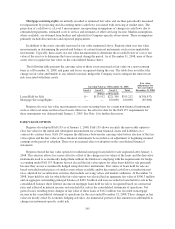
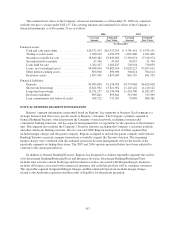
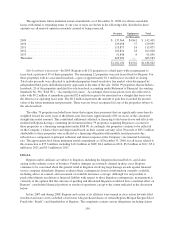
TRADING AND OTHER DERIVATIVES
The following table summarizes the trading and other derivative positions held by Regions as of
December 31:
2008 2007
Contract or
Notional
Amount
Contract or
Notional
Amount
(In millions)
Interest rate swaps ........................................................ $60,210 $30,952
Interest rate options ....................................................... 3,761 3,484
Futures and forward commitments ........................................... 9,164 6,193
Other .................................................................. 903 424
$74,038 $41,053
Credit risk, defined as all positive exposures not collateralized with cash or other assets, at December 31,
2008 and 2007, totaled approximately $1,617.3 million and $501.1 million, respectively. These amounts
represent the net credit risk on all trading and other derivative positions held by Regions.
Prior to 2008, Regions designated forward contracts to hedge the fair value of specific pools of residential
mortgage loans held for sale against changes in interest rates. Beginning January 1, 2008, Regions elected the fair
value option on new originations of residential mortgages held for sale (see Note 23) but continued to
economically hedge these loans with forward rate commitments. At December 31, 2008, Regions had $1,492.1
million in notional amounts of forward rate commitments with a net negative fair value of ($12.1) million. In
140