Regions Bank 2008 Annual Report Download - page 163
Download and view the complete annual report
Please find page 163 of the 2008 Regions Bank annual report below. You can navigate through the pages in the report by either clicking on the pages listed below, or by using the keyword search tool below to find specific information within the annual report.-
 1
1 -
2
-
3
-
4
-
5
-
6
-
7
-
8
-
9
-
10
-
11
-
12
-
13
-
14
-
15
-
16
-
17
-
18
-
19
-
20
-
21
-
22
-
23
-
24
-
25
-
26
-
27
-
28
-
29
-
30
-
31
-
32
-
33
-
34
-
35
-
36
-
37
-
38
-
39
-
40
-
41
-
42
-
43
-
44
-
45
-
46
-
47
-
48
-
49
-
50
-
51
-
52
-
53
-
54
-
55
-
56
-
57
-
58
-
59
-
60
-
61
-
62
-
63
-
64
-
65
-
66
-
67
-
68
-
69
-
70
-
71
-
72
-
73
-
74
-
75
-
76
-
77
-
78
-
79
-
80
-
81
-
82
-
83
-
84
-
85
-
86
-
87
-
88
-
89
-
90
-
91
-
92
-
93
-
94
-
95
-
96
-
97
-
98
-
99
-
100
-
101
-
102
-
103
-
104
-
105
-
106
-
107
-
108
-
109
-
110
-
111
-
112
-
113
-
114
-
115
-
116
-
117
-
118
-
119
-
120
-
121
-
122
-
123
-
124
-
125
-
126
-
127
-
128
-
129
-
130
-
131
-
132
-
133
-
134
-
135
-
136
-
137
-
138
-
139
-
140
-
141
-
142
-
143
-
144
-
145
-
146
-
147
-
148
-
149
-
150
-
151
-
152
-
 153
153 -
 154
154 -
 155
155 -
 156
156 -
 157
157 -
 158
158 -
 159
159 -
 160
160 -
 161
161 -
 162
162 -
 163
163 -
 164
164 -
 165
165 -
 166
166 -
 167
167 -
 168
168 -
 169
169 -
 170
170 -
 171
171 -
 172
172 -
 173
173 -
174
-
175
-
176
-
177
-
178
-
179
-
180
-
181
-
182
-
183
-
184
 |
 |

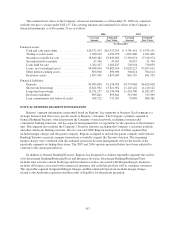
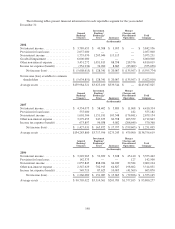
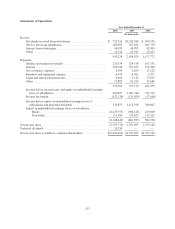
Statements of Operations
Year Ended December 31
2008 2007 2006
(In thousands)
Income:
Dividends received from subsidiaries ....................... $ 725,426 $2,250,386 $ 900,276
Service fees from subsidiaries ............................. 183,093 237,624 201,354
Interest from subsidiaries ................................. 40,035 46,995 42,839
Other ................................................ 10,724 23,915 13,253
959,278 2,558,920 1,157,722
Expenses:
Salaries and employee benefits ............................ 226,574 224,516 167,531
Interest ............................................... 239,724 257,165 192,300
Net occupancy expense .................................. 2,304 2,824 13,232
Furniture and equipment expense .......................... 6,035 8,361 2,371
Legal and other professional fees .......................... 6,062 3,112 17,852
Other ................................................ 72,882 81,194 32,689
553,581 577,172 425,975
Income before income taxes and equity in undistributed earnings
(loss) of subsidiaries .................................. 405,697 1,981,748 731,747
Income tax benefit ...................................... (127,178) (131,050) (57,060)
Income before equity in undistributed earnings (loss) of
subsidiaries and preferred dividends ...................... 532,875 2,112,798 788,807
Equity in undistributed earnings (loss) of subsidiaries:
Banks ............................................ (6,239,753) (986,128) 429,009
Non-banks ........................................ 111,104 124,425 135,329
(6,128,649) (861,703) 564,338
Net income (loss) ........................................... (5,595,774) 1,251,095 1,353,145
Preferred dividends ......................................... 26,236 — —
Net income (loss) available to common shareholders ............... $(5,622,010) $1,251,095 $1,353,145
153