Regions Bank 2008 Annual Report Download - page 127
Download and view the complete annual report
Please find page 127 of the 2008 Regions Bank annual report below. You can navigate through the pages in the report by either clicking on the pages listed below, or by using the keyword search tool below to find specific information within the annual report.-
 1
1 -
2
-
3
-
4
-
5
-
6
-
7
-
8
-
9
-
10
-
11
-
12
-
13
-
14
-
15
-
16
-
17
-
18
-
19
-
20
-
21
-
22
-
23
-
24
-
25
-
26
-
27
-
28
-
29
-
30
-
31
-
32
-
33
-
34
-
35
-
36
-
37
-
38
-
39
-
40
-
41
-
42
-
43
-
44
-
45
-
46
-
47
-
48
-
49
-
50
-
51
-
52
-
53
-
54
-
55
-
56
-
57
-
58
-
59
-
60
-
61
-
62
-
63
-
64
-
65
-
66
-
67
-
68
-
69
-
70
-
71
-
72
-
73
-
74
-
75
-
76
-
77
-
78
-
79
-
80
-
81
-
82
-
83
-
84
-
85
-
86
-
87
-
88
-
89
-
90
-
91
-
92
-
93
-
94
-
95
-
96
-
97
-
98
-
99
-
100
-
101
-
102
-
103
-
104
-
105
-
106
-
107
-
108
-
109
-
110
-
111
-
112
-
113
-
114
-
115
-
116
-
 117
117 -
 118
118 -
 119
119 -
 120
120 -
 121
121 -
 122
122 -
 123
123 -
 124
124 -
 125
125 -
 126
126 -
 127
127 -
 128
128 -
 129
129 -
 130
130 -
 131
131 -
 132
132 -
 133
133 -
 134
134 -
 135
135 -
 136
136 -
 137
137 -
138
-
139
-
140
-
141
-
142
-
143
-
144
-
145
-
146
-
147
-
148
-
149
-
150
-
151
-
152
-
153
-
154
-
155
-
156
-
157
-
158
-
159
-
160
-
161
-
162
-
163
-
164
-
165
-
166
-
167
-
168
-
169
-
170
-
171
-
172
-
173
-
174
-
175
-
176
-
177
-
178
-
179
-
180
-
181
-
182
-
183
-
184
 |
 |

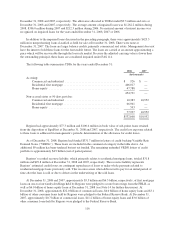
Directors and executive officers of Regions and its principal subsidiaries, including the directors’ and
officers’ families and affiliated companies, are loan and deposit customers and have other transactions with
Regions in the ordinary course of business. Total loans to these persons (excluding loans which in the aggregate
do not exceed $60,000 to any such person) at December 31, 2008 and 2007 were approximately $319 million and
$367 million, respectively. These loans were made in the ordinary course of business and on substantially the
same terms, including interest rates and collateral, as those prevailing at the same time for comparable
transactions with other persons and involve no unusual risk of collectibility.
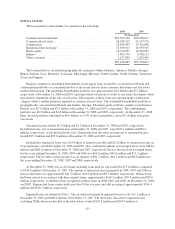
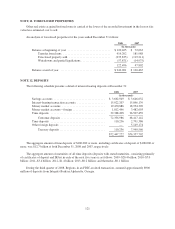
NOTE 7. ALLOWANCE FOR CREDIT LOSSES
The allowance for credit losses consists of the allowance for loan losses, which is presented on the
consolidated balance sheets as a contra-asset to loans, and the reserve for unfunded credit commitments, which is
included in other liabilities in the consolidated balance sheets.
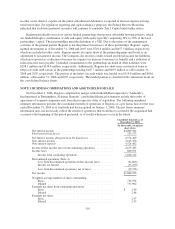
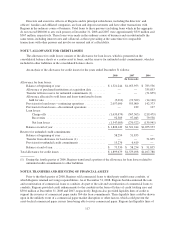
An analysis of the allowance for credit losses for the years ended December 31 follows:
2008 2007 2006
(In thousands)
Allowance for loan losses:
Balance at beginning of year .............................. $1,321,244 $1,055,953 $ 783,536
Allowance of purchased institutions at acquisition date ......... — — 335,833
Transfer to/from reserve for unfunded commitments (1) ........ — — (51,835)
Allowance allocated to sold loans and loans transferred to loans
held for sale ......................................... (5,010) (19,369) (14,140)
Provision for loan losses—continuing operations .............. 2,057,000 555,000 142,373
Provision for loan losses—discontinued operations ............ — 182 127
Loan losses:
Charge-offs ....................................... (1,639,474) (367,565) (219,479)
Recoveries ........................................ 92,389 97,043 79,538
Net loan losses ..................................... (1,547,085) (270,522) (139,941)
Balance at end of year ................................... $1,826,149 $1,321,244 $1,055,953
Reserve for unfunded credit commitments:
Balance at beginning of year .............................. 58,254 51,835 —
Transfer from allowance for loan losses (1) .................. — — 51,835
Provision for unfunded credit commitments .................. 15,276 6,419 —
Balance at end of year ................................... $ 73,530 $ 58,254 $ 51,835
Total allowance for credit losses ............................... $1,899,679 $1,379,498 $1,107,788
(1) During the fourth quarter of 2006, Regions transferred a portion of the allowance for loan losses related to
unfunded credit commitments to other liabilities.
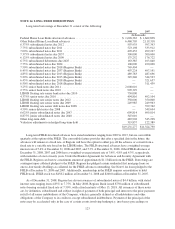
NOTE 8. TRANSFERS AND SERVICING OF FINANCIAL ASSETS
Prior to the third quarter of 2008, Regions sold commercial loans to third-party multi-issuer conduits, of
which Regions retained servicing responsibilities. As of December 31, 2008, Regions had discontinued the sale
and securitization of commercial loans to conduits. As part of the sale and securitization of commercial loans to
conduits, Regions provided credit enhancements to the conduits in the form of letters of credit totaling zero and
$50.0 million at December 31, 2008 and 2007, respectively. Regions also provided liquidity lines of credit to
support the issuance of commercial paper under 364-day loan commitments. These liquidity lines could be drawn
upon in the unlikely event of a commercial paper market disruption or other factors, which could prevent the
asset-backed commercial paper issuers from being able to issue commercial paper. Regions had liquidity lines of
117