Regions Bank 2008 Annual Report Download - page 123
Download and view the complete annual report
Please find page 123 of the 2008 Regions Bank annual report below. You can navigate through the pages in the report by either clicking on the pages listed below, or by using the keyword search tool below to find specific information within the annual report.-
 1
1 -
2
-
3
-
4
-
5
-
6
-
7
-
8
-
9
-
10
-
11
-
12
-
13
-
14
-
15
-
16
-
17
-
18
-
19
-
20
-
21
-
22
-
23
-
24
-
25
-
26
-
27
-
28
-
29
-
30
-
31
-
32
-
33
-
34
-
35
-
36
-
37
-
38
-
39
-
40
-
41
-
42
-
43
-
44
-
45
-
46
-
47
-
48
-
49
-
50
-
51
-
52
-
53
-
54
-
55
-
56
-
57
-
58
-
59
-
60
-
61
-
62
-
63
-
64
-
65
-
66
-
67
-
68
-
69
-
70
-
71
-
72
-
73
-
74
-
75
-
76
-
77
-
78
-
79
-
80
-
81
-
82
-
83
-
84
-
85
-
86
-
87
-
88
-
89
-
90
-
91
-
92
-
93
-
94
-
95
-
96
-
97
-
98
-
99
-
100
-
101
-
102
-
103
-
104
-
105
-
106
-
107
-
108
-
109
-
110
-
111
-
112
-
 113
113 -
 114
114 -
 115
115 -
 116
116 -
 117
117 -
 118
118 -
 119
119 -
 120
120 -
 121
121 -
 122
122 -
 123
123 -
 124
124 -
 125
125 -
 126
126 -
 127
127 -
 128
128 -
 129
129 -
 130
130 -
 131
131 -
 132
132 -
 133
133 -
134
-
135
-
136
-
137
-
138
-
139
-
140
-
141
-
142
-
143
-
144
-
145
-
146
-
147
-
148
-
149
-
150
-
151
-
152
-
153
-
154
-
155
-
156
-
157
-
158
-
159
-
160
-
161
-
162
-
163
-
164
-
165
-
166
-
167
-
168
-
169
-
170
-
171
-
172
-
173
-
174
-
175
-
176
-
177
-
178
-
179
-
180
-
181
-
182
-
183
-
184
 |
 |

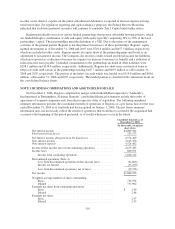
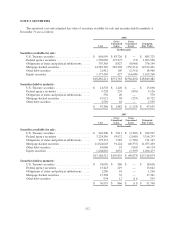
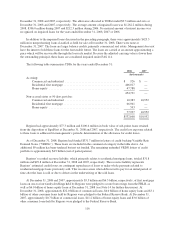
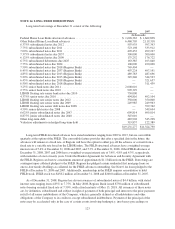
The following tables present the age of gross unrealized losses and estimated fair value by investment
category for securities available for sale at December 31:
2008
Less Than Twelve Months Twelve Months or More Total
Estimated
Fair Value
Unrealized
Losses
Estimated
Fair Value
Unrealized
Losses
Estimated
Fair Value
Unrealized
Losses
(In thousands)
Federal agency securities ....... $ 3,184 $ (22) $ 1,155 $ (31) $ 4,339 $ (53)
Mortgage-backed securities ..... 1,829,992 (422,059) 660,326 (117,172) 2,490,318 (539,231)
All other securities ............ 204,035 (20,946) 137,428 (4,262) 341,463 (25,208)
$2,037,211 $(443,027) $ 798,909 $(121,465) $2,836,120 $(564,492)
2007
Less Than Twelve Months Twelve Months or More Total
Estimated
Fair Value
Unrealized
Losses
Estimated
Fair Value
Unrealized
Losses
Estimated
Fair Value
Unrealized
Losses
(In thousands)
U.S. Treasury securities ........ $ 661,273 $ (3,303) $ 9,983 $ (17) $ 671,256 $ (3,320)
Federal agency securities ....... 401 (1) 702,691 (2,088) 703,092 (2,089)
Mortgage-backed securities ..... 729,973 (2,694) 3,017,234 (37,643) 3,747,207 (40,337)
All other securities ............ 135,536 (1,524) 259,339 (2,603) 394,875 (4,127)
$1,527,183 $ (7,522) $3,989,247 $ (42,351) $5,516,430 $ (49,873)
Regions evaluates securities in a loss position for other-than-temporary impairment, considering such
factors as the length of time and the extent to which the market value has been below cost, the credit standing of
the issuer, and Regions’ ability and intent to hold the security until its market value recovers. Management does
not believe any individual unrealized loss, which was comprised of 1,065 securities and 1,021 securities as of
December 31, 2008 and 2007, respectively, represented an other-than-temporary impairment as of those dates.
The unrealized losses related primarily to the impact of lower interest rates and widening of credit and liquidity
spreads related to U.S. Treasury securities, Federal agency securities and mortgage-backed securities. During
2008 and 2007, Regions recognized a write-down of securities of approximately $28.3 million and $7.2 million,
respectively, representing other-than-temporary impairment, related primarily to equity securities and retained
interests on beneficial interests.
113