Red Lobster 2015 Annual Report Download - page 9
Download and view the complete annual report
Please find page 9 of the 2015 Red Lobster annual report below. You can navigate through the pages in the report by either clicking on the pages listed below, or by using the keyword search tool below to find specific information within the annual report.-
 1
1 -
 2
2 -
 3
3 -
 4
4 -
 5
5 -
 6
6 -
 7
7 -
 8
8 -
 9
9 -
 10
10 -
 11
11 -
 12
12 -
 13
13 -
 14
14 -
 15
15 -
 16
16 -
 17
17 -
 18
18 -
 19
19 -
 20
20 -
21
-
22
-
23
-
24
-
25
-
26
-
27
-
28
-
29
-
30
-
31
-
32
-
33
-
34
-
35
-
36
-
37
-
38
-
39
-
40
-
41
-
42
-
43
-
44
-
45
-
46
-
47
-
48
-
49
-
50
-
51
-
52
-
53
-
54
-
55
-
56
-
57
-
58
-
59
-
60
-
61
-
62
-
63
-
64
-
65
-
66
-
67
-
68
 |
 |

DARDEN RESTAURANTS, INC. | 2015 ANNUAL REPORT 5
2015 Financial Highlights
FISCAL YEAR ENDED
(In Millions, Except Per Share Amounts) May 31, 2015 May 25, 2014 May 26, 2013
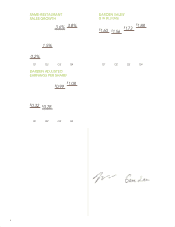
Sales from Continuing Operations $ 6,764.0 $ 6,285.6 $ 5,921.0
Earnings from Continuing Operations $ 196.4 $ 183.2 $ 237.3
Earnings from Discontinued Operations, net of tax $ 513.1 $ 103.0 $ 174.6
Net Earnings $ 709.5 $ 286.2 $ 411.9
Basic Net Earnings Per Share: $ 5.56 $ 2.18 $ 3.19
Earnings from Continuing Operations $ 1.54 $ 1.40 $ 1.84
Earnings from Discontinued Operations $ 4.02 $ 0.78 $ 1.35
Diluted Net Earnings Per Share: $ 5.47 $ 2.15 $ 3.13
Earnings from Continuing Operations $ 1.51 $ 1.38 $ 1.80
Earnings from Discontinued Operations $ 3.96 $ 0.77 $ 1.33
Dividends Paid Per Share $ 2.20 $ 2.20 $ 2.00
Average Shares Outstanding:
Basic 127.7 131.0 129.0
Diluted 129.7 133.2 131.6
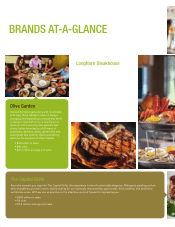
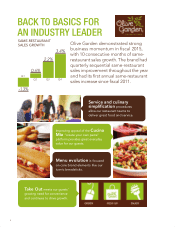
• LongHorn’s total sales were $1.54 billion, up 11.6 percent from
scal 2014. This reected average annual sales per restaurant
of $3.2 million, the addition of 16 net new restaurants and a
U.S. same-restaurant sales increase of 4.4 percent.
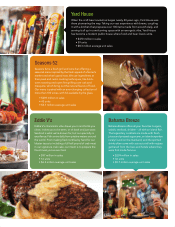
• We continued to build on solid performance at our Specialty
Restaurants, where total sales were $1.42 billion, a 14.8 percent
increase from scal 2014. Total sales increased 11.0 percent at
The Capital Grille to $403 million, based on same-restaurant
sales growth of 4.8 percent. Total sales increased 23.6 percent
at Eddie V’s to $97 million, based on same-restaurant sales
growth of 5.4 percent and the addition of one new restaurant.
Total sales increased 18.8 percent at Yard House to $470 million,
based on same-restaurant sales growth of 3.8 percent and
the addition of seven new restaurants. Total sales increased
21.5 percent at Seasons 52 to $239 million, based on same-
restaurant sales growth of 2.3 percent and the addition of ve
new restaurants. Total sales increased 3.8 percent for Bahama
Breeze to $209 million, based on same-restaurant sales growth
of 1.8 percent.
• We identied more than $100 million of annualized cost
savings, which will not impact the guest experience, to be
achieved by scal 2017. We recognized $35 million of the
identied cost savings in scal 2015. This brought our selling,
general and administrative (SG&A) expense as a percent of
With more than 100 items made from scratch daily, Yard
House has become a modern American gathering place
where food and beer lovers unite.