Red Lobster 2015 Annual Report Download - page 16
Download and view the complete annual report
Please find page 16 of the 2015 Red Lobster annual report below. You can navigate through the pages in the report by either clicking on the pages listed below, or by using the keyword search tool below to find specific information within the annual report.-
 1
1 -
2
-
3
-
4
-
5
-
 6
6 -
 7
7 -
 8
8 -
 9
9 -
 10
10 -
 11
11 -
 12
12 -
 13
13 -
 14
14 -
 15
15 -
 16
16 -
 17
17 -
 18
18 -
 19
19 -
 20
20 -
 21
21 -
 22
22 -
 23
23 -
 24
24 -
 25
25 -
 26
26 -
27
-
28
-
29
-
30
-
31
-
32
-
33
-
34
-
35
-
36
-
37
-
38
-
39
-
40
-
41
-
42
-
43
-
44
-
45
-
46
-
47
-
48
-
49
-
50
-
51
-
52
-
53
-
54
-
55
-
56
-
57
-
58
-
59
-
60
-
61
-
62
-
63
-
64
-
65
-
66
-
67
-
68
 |
 |

12
MANAGEMENT’S DISCUSSION AND ANALYSIS
OF FINANCIAL CONDITION AND RESULTS OF OPERATIONS
DARDEN
RESULTS OF OPERATIONS FOR FISCAL 2015, 2014 AND 2013
To facilitate review of our results of operations, the following table sets forth our financial results for the periods indicated. All information is derived from the
consolidated statements of earnings for the fiscal years ended May 31, 2015, May 25, 2014 and May 26, 2013. This information and the following analysis
have been presented with the results of operations, costs incurred in connection with the sale and related gain on the sale of Red Lobster and results for the
two closed company-owned synergy restaurants classified as discontinued operations for all periods presented.
Percent Change
(in millions) May 31, 2015 May 25, 2014 May 26, 2013 2015 vs 2014 2014 vs 2013
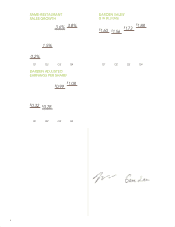
Sales $6,764.0 $6,285.6 $5,921.0 7.6% 6.2%
Costs and expenses:
Food and beverage 2,085.1 1,892.2 1,743.6 10.2% 8.5%
Restaurant labor 2,135.6 2,017.6 1,892.6 5.8% 6.6%
Restaurant expenses 1,120.8 1,080.7 980.4 3.7% 10.2%
Marketing expenses 243.3 252.3 241.1 (3.6)% 4.6%
General and administrative expenses 430.2 413.1 384.1 4.1% 7.6%
Depreciation and amortization 319.3 304.4 278.3 4.9% 9.4%
Impairments and disposal of assets, net 62.1 16.4 0.9 278.7% NM
Total operating costs and expenses $6,396.4 $5,976.7 $ 5,521.0 7.0% 8.3%
Operating income 367.6 308.9 400.0 19.0% (22.8)%
Interest, net 192.3 134.3 126.0 43.2% 6.6%
Earnings before income taxes 175.3 174.6 274.0 0.4% (36.3)%
Income tax (benefit) expense (1) (21.1) (8.6) 36.7 145.3% (123.4)%
Earnings from continuing operations $ 196.4 $ 183.2 $ 237.3 7.2% (22.8)%
Earnings from discontinued operations, net of tax 513.1 103.0 174.6 398.2% (41.0)%
Net earnings $ 709.5 $ 286.2 $ 411.9 147.9% (30.5)%
(1) Effective tax rate (12.0)% (4.9)% 13.4%
The following table details the number of company-owned restaurants currently reported in continuing operations, compared with the number open at the
end of fiscal 2014 and the end of fiscal 2013.
May 31, 2015 May 25, 2014 May 26, 2013
Olive Garden (1) 846 837 828
LongHorn Steakhouse 480 464 430
The Capital Grille 54 54 49
Bahama Breeze 36 37 33
Seasons 52 43 38 31
Eddie V’s 16 15 12
Yard House 59 52 44
Other (2) — 4 4
Total 1,534 1,501 1,431
(1) Includes six locations in Canada for all periods presented.
(2) Represents company-owned synergy restaurants in operation. We completed the conversion of all remaining synergy restaurants into stand-alone Olive Garden restaurants during the first quarter
of fiscal 2015.