Red Lobster 2015 Annual Report Download - page 43
Download and view the complete annual report
Please find page 43 of the 2015 Red Lobster annual report below. You can navigate through the pages in the report by either clicking on the pages listed below, or by using the keyword search tool below to find specific information within the annual report.-
 1
1 -
2
-
3
-
4
-
5
-
6
-
7
-
8
-
9
-
10
-
11
-
12
-
13
-
14
-
15
-
16
-
17
-
18
-
19
-
20
-
21
-
22
-
23
-
24
-
25
-
26
-
27
-
28
-
29
-
30
-
31
-
32
-
 33
33 -
 34
34 -
 35
35 -
 36
36 -
 37
37 -
 38
38 -
 39
39 -
 40
40 -
 41
41 -
 42
42 -
 43
43 -
 44
44 -
 45
45 -
 46
46 -
 47
47 -
 48
48 -
 49
49 -
 50
50 -
 51
51 -
 52
52 -
 53
53 -
54
-
55
-
56
-
57
-
58
-
59
-
60
-
61
-
62
-
63
-
64
-
65
-
66
-
67
-
68
 |
 |

DARDEN RESTAURANTS, INC. | 2015 ANNUAL REPORT 39
NOTES TO CONSOLIDATED FINANCIAL STATEMENTS
DARDEN
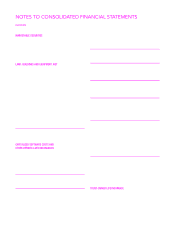
Our management uses segment profit as the measure for assessing performance of our segments. Segment profit includes revenues and expenses
directly attributable to restaurant-level results of operations (sometimes referred to as restaurant-level earnings). These expenses include food and beverage
costs, restaurant labor costs, restaurant expenses and marketing expenses. The following tables reconcile our segment results to our consolidated results
reported in accordance with GAAP:
(in millions)
Olive LongHorn
At May 31, 2015 and for the year ended Garden Steakhouse Fine Dining Other Business Corporate Consolidated
Sales $3,789.6 $1,544.7 $500.1 $ 929.6 $ — $6,764.0
Restaurant and marketing expenses 3,089.1 1,304.8 405.2 785.7 — 5,584.8
Segment profit $ 700.5 $ 239.9 $ 94.9 $143.9 $ — $1,179.2
Depreciation and amortization $ 149.8 $ 71.6 $ 26.4 $ 47.3 $ 24.2 $ 319.3
Impairments and disposal of assets, net 28.2 0.4 — 21.0 12.5 62.1
Segment assets 1,625.1 1,261.1 865.6 1,054.6 1,188.3 5,994.7
Capital expenditures 118.9 67.4 22.9 83.4 3.9 296.5
(in millions)
Olive LongHorn
At May 25, 2014 and for the year ended Garden Steakhouse Fine Dining Other Business Corporate Consolidated
Sales $3,643.1 $1,383.9 $441.6 $ 817.0 $ — $6,285.6
Restaurant and marketing expenses 2,995.1 1,179.6 360.2 707.9 — 5,242.8
Segment profit $ 648.0 $ 204.3 $ 81.4 $ 109.1 $ — $1,042.8
Depreciation and amortization $ 149.6 $ 66.7 $ 24.3 $ 42.7 $ 21.1 $ 304.4
Impairments and disposal of assets, net 3.3 0.8 4.8 3.7 3.8 16.4
Segment assets 1,717.3 1,280.3 871.6 1,087.3 2,126.2 7,082.7
Capital expenditures 131.9 114.4 42.3 123.1 3.1 414.8
(in millions)
Olive LongHorn
For the year ended May 26, 2013 Garden Steakhouse Fine Dining Other Business Corporate Consolidated
Sales $3,684.8 $1,231.2 $396.4 $ 608.6 $ — $5,921.0
Restaurant and marketing expenses 2,977.6 1,043.2 320.3 516.6 — 4,857.7
Segment profit $ 707.2 $ 188.0 $ 76.1 $ 92.0 $ — $1,063.3
Depreciation and amortization $ 144.5 $ 60.1 $ 21.8 $ 32.0 $ 19.9 $ 278.3
Impairments and disposal of assets, net 0.2 0.5 — — 0.2 0.9
Capital expenditures 214.4 151.9 34.4 103.3 6.1 510.1
Reconciliation of segment profit to earnings from continuing operations before income taxes:
Fiscal Year
(in millions)
May 31, 2015 May 25, 2014 May 26, 2013
Segment profit $1,179.2 $1,042.8 $1,063.3
Less general and administrative expenses (430.2) (413.1) (384.1)
Less depreciation and amortization (319.3) (304.4) (278.3)
Less impairments and disposal of assets, net (62.1) (16.4) (0.9)
Less interest, net (192.3) (134.3) (126.0)
Earnings before income taxes $ 175.3 $ 174.6 $ 274.0