Red Lobster 2015 Annual Report Download - page 40
Download and view the complete annual report
Please find page 40 of the 2015 Red Lobster annual report below. You can navigate through the pages in the report by either clicking on the pages listed below, or by using the keyword search tool below to find specific information within the annual report.-
 1
1 -
2
-
3
-
4
-
5
-
6
-
7
-
8
-
9
-
10
-
11
-
12
-
13
-
14
-
15
-
16
-
17
-
18
-
19
-
20
-
21
-
22
-
23
-
24
-
25
-
26
-
27
-
28
-
29
-
 30
30 -
 31
31 -
 32
32 -
 33
33 -
 34
34 -
 35
35 -
 36
36 -
 37
37 -
 38
38 -
 39
39 -
 40
40 -
 41
41 -
 42
42 -
 43
43 -
 44
44 -
 45
45 -
 46
46 -
 47
47 -
 48
48 -
 49
49 -
 50
50 -
51
-
52
-
53
-
54
-
55
-
56
-
57
-
58
-
59
-
60
-
61
-
62
-
63
-
64
-
65
-
66
-
67
-
68
 |
 |

36
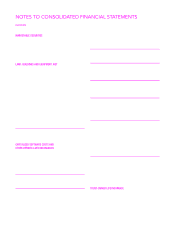
NOTES TO CONSOLIDATED FINANCIAL STATEMENTS
DARDEN
PRE-OPENING EXPENSES
Non-capital expenditures associated with opening new restaurants are
expensed as incurred.
ADVERTISING
Production costs of commercials are charged to operations in the fiscal
period the advertising is first aired. The costs of programming and other
advertising, promotion and marketing programs are charged to operations
in the fiscal period incurred and reported as marketing expenses on our
consolidated statements of earnings.
STOCK-BASED COMPENSATION
We recognize the cost of employee service received in exchange for awards
of equity instruments based on the grant date fair value of those awards. We
utilize the Black-Scholes option pricing model to estimate the fair value of
stock option awards. We recognize compensation expense on a straight-line
basis over the employee service period for awards granted. The dividend
yield has been estimated based upon our historical results and expectations
for changes in dividend rates. The expected volatility was determined using
historical stock prices. The risk-free interest rate was the rate available on
zero coupon U.S. government obligations with a term approximating the
expected life of each grant. The expected life was estimated based on the
exercise history of previous grants, taking into consideration the remaining
contractual period for outstanding awards. The weighted-average fair value
of non-qualified stock options and the related assumptions used in the
Black-Scholes model to record stock-based compensation are as follows:
Stock Options
Granted in Fiscal Year
2015 2014 2013
Weighted-average fair value $10.59 $12.06 $12.22
Dividend yield 4.5% 4.4% 4.0%
Expected volatility of stock 37.3% 39.6% 39.7%
Risk-free interest rate 2.1% 1.9% 0.8%
Expected option life (in years) 6.5 6.4 6.5
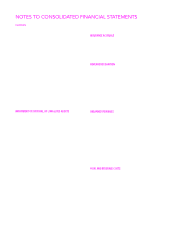
NET EARNINGS PER SHARE
Basic net earnings per share are computed by dividing net earnings by the
weighted-average number of common shares outstanding for the reporting
period. Diluted net earnings per share reflect the potential dilution that could
occur if securities or other contracts to issue common stock were exercised or
converted into common stock. Outstanding stock options and restricted stock
granted by us represent the only dilutive effect reflected in diluted weighted-
average shares outstanding. These stock-based compensation instruments do
not impact the numerator of the diluted net earnings per share computation.
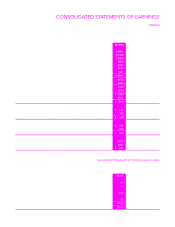
The following table presents the computation of basic and diluted net
earnings per common share:
Fiscal Year
(in millions, except per share data)
2015 2014 2013
Earnings from continuing operations $196.4 $183.2 $237.3
Earnings from discontinued operations 513.1 103.0 174.6
Net earnings $709.5 $286.2 $411.9
Average common shares
outstanding – Basic 127.7 131.0 129.0
Effect of dilutive stock-based
compensation 2.0 2.2 2.6
Average common shares
outstanding – Diluted 129.7 133.2 131.6
Basic net earnings per share:
Earnings from continuing operations $ 1.54 $ 1.40 $ 1.84
Earnings from discontinued operations 4.02 0.78 1.35
Net earnings $ 5.56 $ 2.18 $ 3.19
Diluted net earnings per share:
Earnings from continuing operations $ 1.51 $ 1.38 $ 1.80
Earnings from discontinued operations 3.96 0.77 1.33
Net earnings $ 5.47 $ 2.15 $ 3.13
Restricted stock and options to purchase shares of our common stock
excluded from the calculation of diluted net earnings per share because the
effect would have been anti-dilutive, are as follows:
Fiscal Year Ended
May 31, May 25, May 26,
(in millions)
2015 2014 2013
Anti-dilutive restricted stock and options 0.1 4.2 2.8
COMPREHENSIVE INCOME
Comprehensive income includes net earnings and other comprehensive
income (loss) items that are excluded from net earnings under U.S. generally
accepted accounting principles. Other comprehensive income (loss) items
include foreign currency translation adjustments, the effective unrealized
portion of changes in the fair value of cash flow hedges, unrealized gains and
losses on our marketable securities classified as held for sale and recognition
of the funded status related to our pension and other postretirement plans.
See Note 13 – Stockholders’ Equity for additional information.
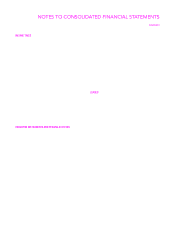
FOREIGN CURRENCY
The Canadian dollar is the functional currency for our Canadian restaurant
operations and the Malaysian ringgit is the functional currency for our
franchises based in Malaysia. Assets and liabilities denominated in foreign
currencies are translated into U.S. dollars using the exchange rates in effect
at the balance sheet date. Results of operations are translated using the
average exchange rates prevailing throughout the period. Translation gains
and losses are reported as a separate component of other comprehensive
income (loss). Aggregate cumulative translation losses were $1.7 million
and $4.7 million at May 31, 2015 and May 25, 2014, respectively. Net losses
from foreign currency transactions recognized in our consolidated statements
of earnings were $1.4 million for fiscal 2015 and were not significant for
fiscal 2014 or 2013.