Red Lobster 2015 Annual Report Download - page 34
Download and view the complete annual report
Please find page 34 of the 2015 Red Lobster annual report below. You can navigate through the pages in the report by either clicking on the pages listed below, or by using the keyword search tool below to find specific information within the annual report.-
 1
1 -
2
-
3
-
4
-
5
-
6
-
7
-
8
-
9
-
10
-
11
-
12
-
13
-
14
-
15
-
16
-
17
-
18
-
19
-
20
-
21
-
22
-
23
-
 24
24 -
 25
25 -
 26
26 -
 27
27 -
 28
28 -
 29
29 -
 30
30 -
 31
31 -
 32
32 -
 33
33 -
 34
34 -
 35
35 -
 36
36 -
 37
37 -
 38
38 -
 39
39 -
 40
40 -
 41
41 -
 42
42 -
 43
43 -
 44
44 -
45
-
46
-
47
-
48
-
49
-
50
-
51
-
52
-
53
-
54
-
55
-
56
-
57
-
58
-
59
-
60
-
61
-
62
-
63
-
64
-
65
-
66
-
67
-
68
 |
 |
30
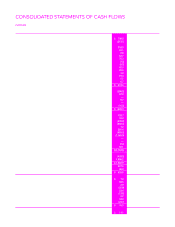
CONSOLIDATED STATEMENTS OF CASH FLOWS
DARDEN
Fiscal Year Ended
May 31, May 25, May 26,
(in millions) 2015 2014 2013
Cash flows – operating activities
Net earnings $ 709.5 $ 286.2 $ 411.9
Earnings from discontinued operations, net of tax (513.1) (103.0) (174.6)
Adjustments to reconcile net earnings from continuing operations to cash flows:
Depreciation and amortization 319.3 304.4 278.3
Impairments and disposal of assets, net 62.1 16.4 0.9
Amortization of loan costs and losses on interest-rate related derivatives 8.6 13.8 13.0
Stock-based compensation expense 53.7 38.7 40.0
Change in current assets and liabilities 76.3 0.6 (18.0)
Contributions to pension and postretirement plans (1.5) (1.4) (3.2)
Change in cash surrender value of trust-owned life insurance (6.5) (12.2) (16.8)
Deferred income taxes 42.0 (44.9) (0.4)
Change in deferred rent 22.0 29.5 25.6
Change in other assets and liabilities 3.8 18.9 24.0
Loss on extinguishment of debt 91.3 — —
Income tax benefits from exercise of stock-based compensation credited to goodwill 0.1 0.2 0.1
Other, net 6.7 8.2 13.6
Net cash provided by operating activities of continuing operations $ 874.3 $ 555.4 $ 594.4
Cash flows – investing activities
Purchases of land, buildings and equipment (296.5) (414.8) (510.1)
Proceeds from disposal of land, buildings and equipment 67.9 4.4 0.3
Purchases of marketable securities — (3.0) (12.9)
Proceeds from sale of marketable securities 9.7 8.7 26.0
Cash used in business acquisitions, net of cash acquired — — (577.4)
Increase in other assets (16.2) (31.6) (40.5)
Net cash used in investing activities of continuing operations $ (235.1) $ (436.3) $(1,114.6)
Cash flows – financing activities
Proceeds from issuance of common stock 159.7 58.1 64.4
Income tax benefits credited to equity 18.4 10.9 13.6
Dividends paid (278.9) (288.3) (258.2)
Repurchases of common stock (502.3) (0.5) (52.4)
ESOP note receivable repayments 1.2 0.9 1.1
Proceeds from issuance of short-term debt 397.4 2,616.3 2,670.3
Repayments of short-term debt (605.0) (2,573.2) (2,768.4)
Repayments of long-term debt (1,065.9) — (355.9)
Proceeds from issuance of long-term debt — — 1,050.0
Payment of debt issuance costs — (1.4) (7.4)
Principal payments on capital leases (2.2) (2.0) (1.7)
Proceeds from financing lease obligation 93.1 — —
Net cash (used in) provided by financing activities of continuing operations $(1,784.5) $ (179.2) $ 355.4
Cash flows – discontinued operations
Net cash (used in) provided by operating activities of discontinued operations (403.3) 214.7 354.9
Net cash provided by (used in) investing activities of discontinued operations 1,986.2 (144.5) (172.4)
Net cash provided by discontinued operations $ 1,582.9 $ 70.2 $ 182.5
Increase in cash and cash equivalents 437.6 10.1 17.7
Cash and cash equivalents – beginning of year 98.3 88.2 70.5
Cash and cash equivalents – end of year $ 535.9 $ 98.3 $ 88.2
Cash flows from changes in current assets and liabilities
Receivables, net $ 7.8 $ (1.5) $ (11.1)
Inventories 64.5 (25.6) (1.8)
Prepaid expenses and other current assets 2.9 0.5 (11.1)
Accounts payable (20.9) 27.2 4.4
Accrued payroll 23.4 7.5 (5.9)
Prepaid/accrued income taxes (13.8) (21.0) 22.5
Other accrued taxes 2.2 — 7.7
Unearned revenues 34.9 28.8 33.9
Other current liabilities (24.7) (15.3) (56.6)
Change in current assets and liabilities $ 76.3 $ 0.6 $ (18.0)
Supplemental schedule of noncash investing activities:
Increase in land, buildings and equipment through accrued purchases $ 11.1 $ 24.4 $ 42.2
See accompanying notes to consolidated financial statements.