Red Lobster 2015 Annual Report Download - page 10
Download and view the complete annual report
Please find page 10 of the 2015 Red Lobster annual report below. You can navigate through the pages in the report by either clicking on the pages listed below, or by using the keyword search tool below to find specific information within the annual report.-
 1
1 -
 2
2 -
 3
3 -
 4
4 -
 5
5 -
 6
6 -
 7
7 -
 8
8 -
 9
9 -
 10
10 -
 11
11 -
 12
12 -
 13
13 -
 14
14 -
 15
15 -
 16
16 -
 17
17 -
 18
18 -
 19
19 -
 20
20 -
 21
21 -
22
-
23
-
24
-
25
-
26
-
27
-
28
-
29
-
30
-
31
-
32
-
33
-
34
-
35
-
36
-
37
-
38
-
39
-
40
-
41
-
42
-
43
-
44
-
45
-
46
-
47
-
48
-
49
-
50
-
51
-
52
-
53
-
54
-
55
-
56
-
57
-
58
-
59
-
60
-
61
-
62
-
63
-
64
-
65
-
66
-
67
-
68
 |
 |
6
sales in scal 2015 to the lowest level since Darden became
a public company 20 years ago.
• Finally, we continued to return signicant capital to shareholders
through an annual dividend of $2.20 per share. Also, using
proceeds from the sale of Red Lobster completed in scal
2015, we retired $1.0 billion of debt and repurchased more
than 10.0 million shares of stock as part of our share repurchase
program. Since the share repurchase program began in 1995,
we have repurchased 182 million shares of our common stock
for $4.3 billion.
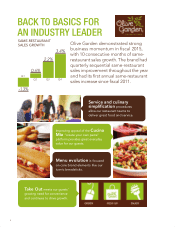
Now is an exciting time to be a Darden shareholder. With seven
great brands, we are well positioned to build protable sales
growth and win in the marketplace through a combination of:
1. Same-restaurant sales growth;
2. Aggressive cost and capital management; and
3. Value-creating new restaurants.
Darden benets from a clear strategy and a culture of
accountability that is strongly embraced by our 150,000 team
members. We appreciate our people and we appreciate our
culture. These are two big reasons why we are condent we
will continue our long-term record of delivering compelling
value for years to come.
Thank you for your continued support.
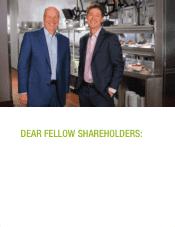
Eugene I. Lee, Jr.
President and
Chief Executive Ofcer
Jeffrey C. Smith
Chairman of the Board
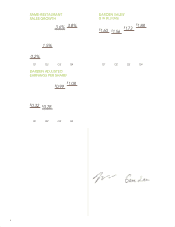
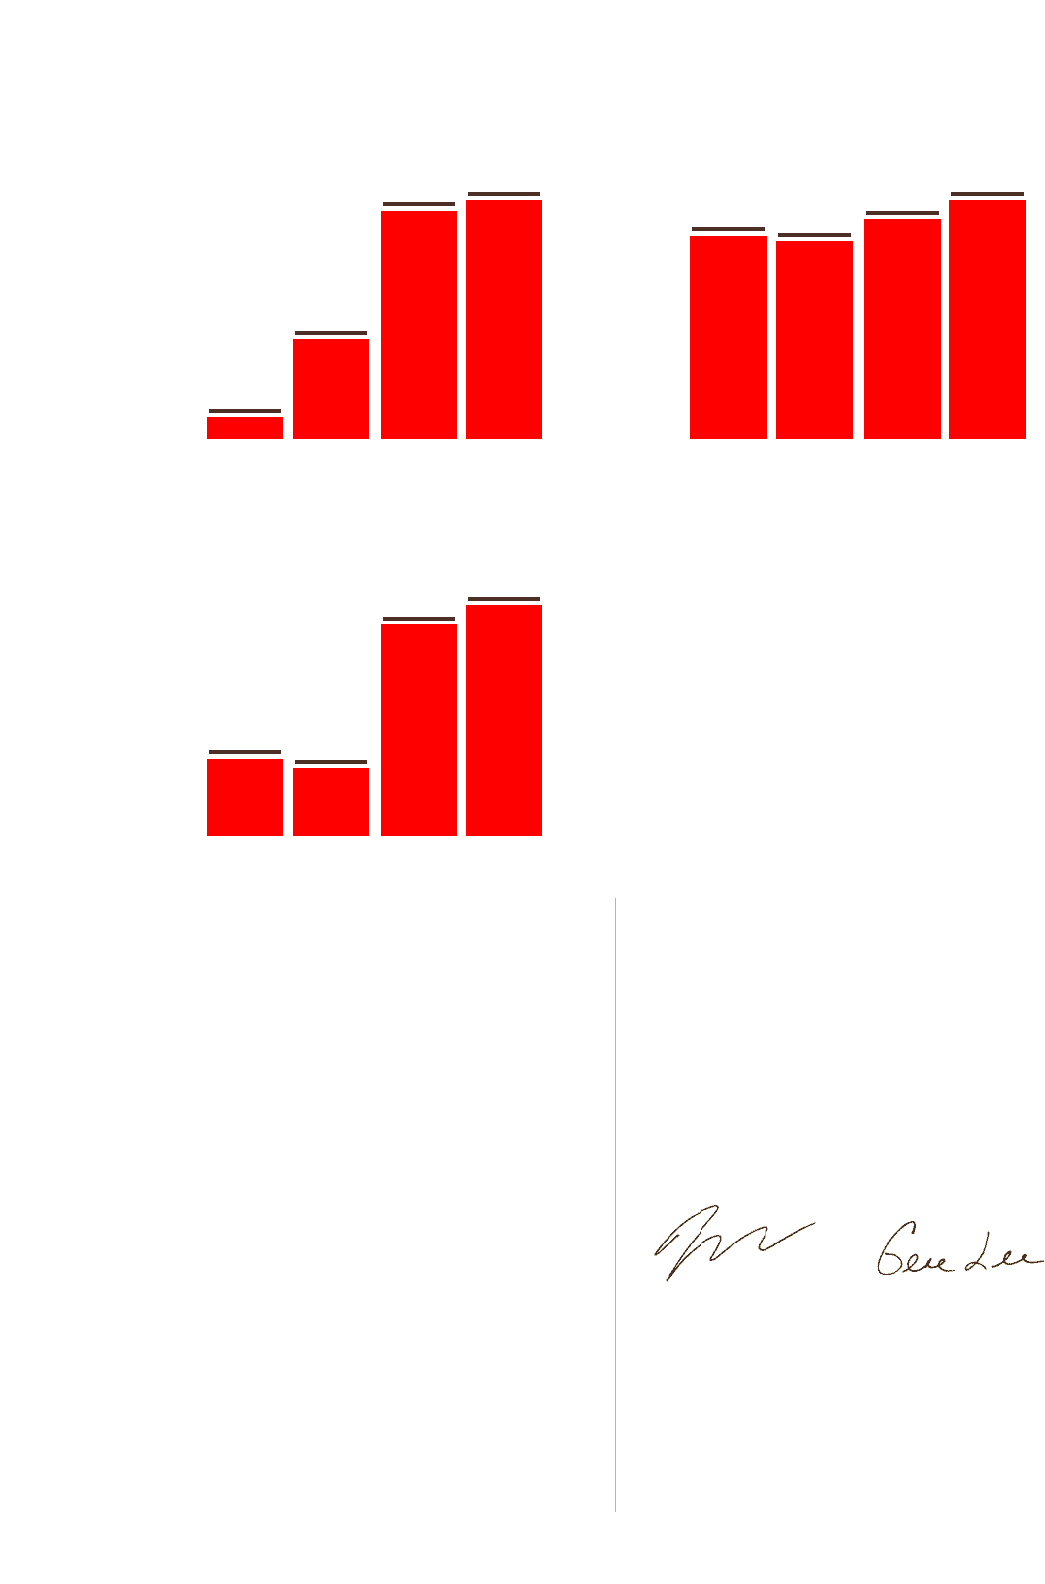
0.2%
SAME-RESTAURANT
SALES GROWTH
Q1
1.5%
Q2
3.6%
Q3
3.8%
Q4
$0.32
DARDEN ADJUSTED
EARNINGS PER SHARE2
Q1
$0.28
Q2
$0.99
Q3
$1.08
Q4
$1.60
DARDEN SALES1
($ IN BILLIONS)
Q1
$1.56
Q2
$1.73
Q3
$1.88
Q4
1 Total sales in scal 2015 Q4 includes the impact of
the additional week due to a 53-week scal year.
Excluding the extra week, total sales were $1.75B,
a growth of 6.3%.
2 EPS values adjusted for one-time costs, including
impairments, G&A transfer to Red Lobster and strategic
action costs. A reconciliation of GAAP to non-GAAP
numbers can be found on page 61.