Red Lobster 2015 Annual Report Download - page 14
Download and view the complete annual report
Please find page 14 of the 2015 Red Lobster annual report below. You can navigate through the pages in the report by either clicking on the pages listed below, or by using the keyword search tool below to find specific information within the annual report.-
 1
1 -
2
-
3
-
 4
4 -
 5
5 -
 6
6 -
 7
7 -
 8
8 -
 9
9 -
 10
10 -
 11
11 -
 12
12 -
 13
13 -
 14
14 -
 15
15 -
 16
16 -
 17
17 -
 18
18 -
 19
19 -
 20
20 -
 21
21 -
 22
22 -
 23
23 -
 24
24 -
25
-
26
-
27
-
28
-
29
-
30
-
31
-
32
-
33
-
34
-
35
-
36
-
37
-
38
-
39
-
40
-
41
-
42
-
43
-
44
-
45
-
46
-
47
-
48
-
49
-
50
-
51
-
52
-
53
-
54
-
55
-
56
-
57
-
58
-
59
-
60
-
61
-
62
-
63
-
64
-
65
-
66
-
67
-
68
 |
 |

MANAGEMENT’S DISCUSSION AND ANALYSIS
OF FINANCIAL CONDITION AND RESULTS OF OPERATIONS
DARDEN
10
This discussion and analysis below for Darden Restaurants, Inc. (Darden, the
Company, we, us or our) should be read in conjunction with our consolidated
financial statements and related financial statement notes found elsewhere
in this report. We operate on a 52/53 week fiscal year, which ends on the
last Sunday in May, which for fiscal 2015 was May 31, 2015. Accordingly,
fiscal 2015 consisted of 53 weeks of operation. Fiscal 2014 and 2013, which
ended May 25, 2014 and May 26, 2013, respectively, each consisted of
52 weeks of operation.
OVERVIEW OF OPERATIONS
Our business operates in the full-service dining segment of the restaurant
industry. At May 31, 2015, we operated 1,534 restaurants through subsid-
iaries in the United States and Canada under the Olive Garden®, LongHorn
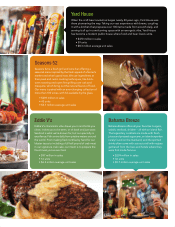
Steakhouse®, The Capital Grille®, Yard House®, Bahama Breeze®, Seasons 52®,
and Eddie V’s Prime Seafood® and Wildfish Seafood Grille® (collectively,
Eddie V’s) trademarks. We own and operate all of our restaurants in the United
States and Canada, except for three restaurants located in Central Florida and
three restaurants in California that are owned jointly by us and third parties,
and managed by us, one franchised restaurant in Atlanta, one franchised
restaurant in Detroit and eight franchised restaurants in Puerto Rico. We also
have area development and franchise agreements with unaffiliated operators
to develop and operate our brands in Asia, the Middle East and Latin America.
Pursuant to these agreements, as of May 31, 2015, 24 franchised restaurants
were in operation in the Middle East, Mexico, Brazil, Peru, El Salvador and
Malaysia. All significant inter-company balances and transactions have been
eliminated in consolidation.
On May 15, 2014, we entered into an agreement to sell Red Lobster and
certain related assets and associated liabilities. On July 28, 2014, we closed
on the sale of 705 Red Lobster restaurants; however, as of May 31, 2015,
9 of the properties remain subject to landlord consents and satisfaction of
other contractual requirements. The remaining consents and contractual
requirements are expected to be satisfied within the next six months. Therefore,
the assets of these remaining restaurants continue to be classified as held
for sale on our consolidated balance sheet and recognition of the gain on the
related proceeds was deferred. As of May 31, 2015, we had received $2.08
billion in cash proceeds, net of transaction-related costs of approximately
$29.3 million. During fiscal 2015, we recognized a pre-tax gain on the sale of
Red Lobster of $837.0 million, which is included in earnings from discontinued
operations in our consolidated statement of earnings. Additionally, in the
fourth quarter of fiscal 2014, in connection with the expected sale of Red
Lobster, we closed two of the six restaurants that housed both a Red Lobster
and an Olive Garden in the same building (synergy restaurants). In the first
quarter of fiscal 2015, we completed the conversion of the four remaining
company-owned synergy restaurants to stand-alone Olive Garden restaurants.
See Note 2 to our consolidated financial statements in this report, incorporated
herein by reference.
We believe that capable operators of strong, multi-unit brands have the
opportunity to increase their share of the restaurant industry’s full-service
segment. Generally, the restaurant industry is considered to be comprised of
three segments: quick service, fast casual, and full service. All of our restau-
rants fall within the full-service segment, which is highly fragmented and
includes many independent operators and small chains. We believe we have
strong brands, and that the breadth and depth of our experience and expertise
sets us apart in the full-service segment of the restaurant industry. This
collective capability is the product of investments over many years in areas
that are critical to success in our business, including restaurant operations
excellence, brand management excellence, supply chain, talent management
and information technology, among other things.
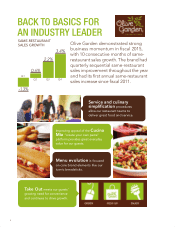
With a focus on growing same restaurant sales, we’ve implemented a
“Back-to-Basics” approach rooted in strong operating fundamentals. We’re
focused on improving culinary innovation and execution inside each of our
brands, delivering attentive service to each and every one of our guests, and
creating an inviting and engaging atmosphere inside our restaurants. We
support these priorities with smart and relevant integrated marketing programs
that resonate with our guests. By delivering on these operational and brand
building imperatives, we expect to increase our market share through same-
restaurant sales growth and deliver best-in-class profitability.
The Darden support structure enables our brands to achieve their ultimate
potential by: 1) driving advantages in supply chain and general and adminis-
trative support; 2) applying insights collected from our significant guest and
transactional databases to enhance guest relationships and identify new
opportunities to drive sales growth; and 3) relentlessly driving operating
efficiencies and continuous improvement, operating with a sense of urgency
and inspiring a performance-driven culture.
We seek to increase profits by leveraging our fixed and semi-fixed costs
with sales from new restaurants and increased guest traffic and sales at existing
restaurants. To evaluate our operations and assess our financial performance,
we monitor a number of operating measures, with a special focus on two
key factors:
• Same-restaurant sales – which is a year-over-year 52-week comparison
of each period’s sales volumes for restaurants open at least 16 months,
including recently acquired restaurants, regardless of when the
restaurants were acquired; and
• Restaurant-level earnings – which is restaurant sales, less food
and beverage costs, restaurant labor costs, restaurant expenses
and marketing expenses.
Increasing same-restaurant sales can improve restaurant earnings
because these incremental sales provide better leverage of our fixed and
semi-fixed restaurant-level costs. A restaurant brand can generate same-
restaurant sales increases through increases in guest traffic, increases in the
average guest check, or a combination of the two. The average guest check
can be impacted by menu price changes and by the mix of menu items sold.
For each restaurant brand, we gather daily sales data and regularly analyze
the guest traffic counts and the mix of menu items sold to aid in developing
menu pricing, product offerings and promotional strategies. We focus on
balancing our pricing and product offerings with other initiatives to produce
sustainable same-restaurant sales growth.