Red Lobster 2015 Annual Report Download - page 18
Download and view the complete annual report
Please find page 18 of the 2015 Red Lobster annual report below. You can navigate through the pages in the report by either clicking on the pages listed below, or by using the keyword search tool below to find specific information within the annual report.
14
MANAGEMENT’S DISCUSSION AND ANALYSIS
OF FINANCIAL CONDITION AND RESULTS OF OPERATIONS
DARDEN
Total operating costs and expenses from continuing operations were
$6.40 billion in fiscal 2015, $5.98 billion in fiscal 2014 and $5.52 billion in
fiscal 2013. As a percent of sales, total costs and expenses from continuing
operations were 94.6 percent in fiscal 2015, 95.1 percent in fiscal 2014
and 93.3 percent in fiscal 2013.
Fiscal 2015 Compared to Fiscal 2014:
• Food and beverage costs increased as percent of sales as a result of
food cost inflation, primarily dairy and beef, and increased costs for
promotional items, partially offset by pricing and favorable menu mix.
• Restaurant labor costs decreased as a percent of sales primarily as a
result of sales leverage.
• Restaurant expenses (which include utilities, repairs and maintenance,
credit card, lease, property tax, workers’ compensation, new restaurant
pre-opening, rent expense and other restaurant-level operating
expenses) decreased as a percent of sales, primarily as a result of
sales leverage and lower new restaurant pre-opening expenses.
• Marketing expenses decreased as a percent of sales, primarily as a
result of sales leverage and reduced media costs.
• General and administrative expenses decreased as a percent of sales,
primarily as a result of sales leverage and support cost savings net of
costs related to implementation of the strategic action plan.
• Depreciation and amortization expense as a percent of sales decreased
primarily due to lower net new restaurants and remodel activities as
compared to the prior year.
• Net interest expense increased as a percent of sales primarily due
to $91.3 million of debt breakage costs related to the retirement of
$1.01 billion in principal of long-term debt.
Fiscal 2014 Compared to Fiscal 2013:
• Food and beverage costs increased as percent of sales primarily as a
result of food cost inflation partially offset by pricing.
• Restaurant labor costs increased as a percent of sales primarily as a
result of wage-rate inflation and decreased labor efficiency, partially
offset by sales leverage.
• Restaurant expenses (which include utilities, repairs and maintenance,
credit card, lease, property tax, workers’ compensation, new restaurant
pre-opening, rent expense and other restaurant-level operating expenses)
increased as a percent of sales, primarily due to an increase in rent
expense and higher repairs and maintenance expenses.
• Marketing expenses decreased as a percent of sales, primarily as a
result of sales leverage.
• General and administrative expenses increased as a percent of sales
primarily as a result of the costs related to implementation of the
strategic action plan and workforce reductions, partially offset by
sales leverage.
• Depreciation and amortization expense as a percent of sales increased
primarily due to an increase in depreciable assets related to new
restaurants and remodel activities.
• Net interest expense as a percent of sales was essentially flat.
INCOME TAXES
The effective income tax rates for fiscal 2015, 2014 and 2013 for continuing
operations were (12.0) percent, (4.9) percent and 13.4 percent, respectively.
Our effective tax rate from continuing operations was negative in both fiscal
2015 and fiscal 2014 primarily due to the impact of certain tax credits on lower
earnings before income taxes. The decrease in our effective tax rate for fiscal
2015 compared to fiscal 2014 is primarily attributable to the impact of the
favorable resolution of prior-year tax matters. The decrease in our effective
rate for fiscal 2014 compared to fiscal 2013 is primarily due to an increase
in the impact of certain tax credits on lower earnings before income taxes
and a favorable adjustment related to the deduction of ESOP dividends for
the current and prior years, partially offset by the impact of market-driven
changes in the value of our trust-owned life insurance that are excluded for
tax purposes.
The effective income tax rates for fiscal 2015, 2014 and 2013 for
discontinued operations were 40.2 percent, 23.9 percent and 29.4 percent,
respectively. The increase in the effective rate for fiscal 2015 compared to fiscal
2014 was driven by the gain on the sale of Red Lobster of $837.0 million,
which is included in earnings from discontinued operations in our consolidated
statement of earnings. The decrease in the effective rate for fiscal 2014
compared to fiscal 2013 is primarily due to an increase in the impact of
certain tax credits on lower earnings before income taxes.
NET EARNINGS AND NET EARNINGS PER SHARE
FROM CONTINUING OPERATIONS
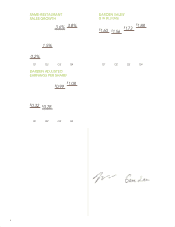
Net earnings from continuing operations for fiscal 2015 were $196.4 million
($1.51 per diluted share) compared with net earnings from continuing operations
for fiscal 2014 of $183.2 million ($1.38 per diluted share) and net earnings from
continuing operations for fiscal 2013 of $237.3 million ($1.80 per diluted share).
Net earnings from continuing operations for fiscal 2015 increased
7.2 percent and diluted net earnings per share from continuing operations
increased 9.4 percent compared with fiscal 2014, primarily due to increased
sales and a lower effective income tax rate and lower restaurant labor expenses,
restaurant expenses and marketing expenses as a percent of sales, partially
offset by higher food and beverage costs, general and administrative expenses
and impairments and disposal of assets, net as a percent of sales. Our diluted
net earnings per share from continuing operations for fiscal 2015 were
adversely impacted by approximately $1.10, comprised of:
• Approximately $0.42 due to debt breakage costs related to the
retirement of $1.01 billion in principal of long-term debt;
• Approximately $0.33 due to corporate and restaurant-related asset
impairments and impairment of assets (net of related tax benefits)
associated with our lobster aquaculture project;
• Approximately $0.20 due to severance and other costs associated
with the support expense reduction efforts announced in the second
quarter; and
• Approximately $0.15 due to legal, financial advisory and other costs
related to strategic action plan costs and associated actions in the
proxy contest.


