Red Lobster 2015 Annual Report Download - page 31
Download and view the complete annual report
Please find page 31 of the 2015 Red Lobster annual report below. You can navigate through the pages in the report by either clicking on the pages listed below, or by using the keyword search tool below to find specific information within the annual report.-
 1
1 -
2
-
3
-
4
-
5
-
6
-
7
-
8
-
9
-
10
-
11
-
12
-
13
-
14
-
15
-
16
-
17
-
18
-
19
-
20
-
 21
21 -
 22
22 -
 23
23 -
 24
24 -
 25
25 -
 26
26 -
 27
27 -
 28
28 -
 29
29 -
 30
30 -
 31
31 -
 32
32 -
 33
33 -
 34
34 -
 35
35 -
 36
36 -
 37
37 -
 38
38 -
 39
39 -
 40
40 -
 41
41 -
42
-
43
-
44
-
45
-
46
-
47
-
48
-
49
-
50
-
51
-
52
-
53
-
54
-
55
-
56
-
57
-
58
-
59
-
60
-
61
-
62
-
63
-
64
-
65
-
66
-
67
-
68
 |
 |
DARDEN RESTAURANTS, INC. | 2015 ANNUAL REPORT 27
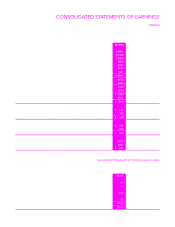
CONSOLIDATED STATEMENTS OF EARNINGS
DARDEN
Fiscal Year Ended
May 31, May 25, May 26,
(in millions, except per share data) 2015 2014 2013
Sales $6,764.0 $6,285.6 $5,921.0
Costs and expenses:
Food and beverage 2,085.1 1,892.2 1,743.6
Restaurant labor 2,135.6 2,017.6 1,892.6
Restaurant expenses 1,120.8 1,080.7 980.4
Marketing expenses 243.3 252.3 241.1
General and administrative expenses 430.2 413.1 384.1
Depreciation and amortization 319.3 304.4 278.3
Impairments and disposal of assets, net 62.1 16.4 0.9
Total operating costs and expenses $6,396.4 $5,976.7 $5,521.0
Operating income 367.6 308.9 400.0
Interest, net 192.3 134.3 126.0
Earnings before income taxes 175.3 174.6 274.0
Income tax (benefit) expense (21.1) (8.6) 36.7
Earnings from continuing operations $ 196.4 $ 183.2 $ 237.3
Earnings from discontinued operations, net of tax expense of $344.8, $32.3 and $72.7, respectively 513.1 103.0 174.6
Net earnings $ 709.5 $ 286.2 $ 411.9
Basic net earnings per share:
Earnings from continuing operations $ 1.54 $ 1.40 $ 1.84
Earnings from discontinued operations 4.02 0.78 1.35
Net earnings $ 5.56 $ 2.18 $ 3.19
Diluted net earnings per share:
Earnings from continuing operations $ 1.51 $ 1.38 $ 1.80
Earnings from discontinued operations 3.96 0.77 1.33
Net earnings $ 5.47 $ 2.15 $ 3.13
Average number of common shares outstanding:
Basic 127.7 131.0 129.0
Diluted 129.7 133.2 131.6
Dividends declared per common share $ 2.20 $ 2.20 $ 2.00
See accompanying notes to consolidated financial statements.
Consolidated Statements of Comprehensive Income
Fiscal Year Ended
May 31, May 25, May 26,
(in millions) 2015 2014 2013
Net earnings $709.5 $286.2 $411.9
Other comprehensive income (loss):
Foreign currency adjustment 3.0 (2.9) (0.2)
Change in fair value of marketable securities, net of taxes of $0.0, $0.0 and $(0.1), respectively —(0.1) (0.2)
Change in fair value of derivatives and amortization of unrecognized gains and losses on derivatives,
net of taxes of $17.4, $3.9 and $(0.6), respectively 31.3 3.4 (4.1)
Net unamortized gain arising during period, including amortization of unrecognized net actuarial loss,
net of taxes of $4.8, $2.9 and $11.3, respectively 7.2 4.3 18.3
Other comprehensive income $ 41.5 $ 4.7 $ 13.8
Total comprehensive income $751.0 $290.9 $425.7
See accompanying notes to consolidated financial statements.