Red Lobster 2015 Annual Report Download - page 7
Download and view the complete annual report
Please find page 7 of the 2015 Red Lobster annual report below. You can navigate through the pages in the report by either clicking on the pages listed below, or by using the keyword search tool below to find specific information within the annual report.-
 1
1 -
 2
2 -
 3
3 -
 4
4 -
 5
5 -
 6
6 -
 7
7 -
 8
8 -
 9
9 -
 10
10 -
 11
11 -
 12
12 -
 13
13 -
 14
14 -
 15
15 -
 16
16 -
 17
17 -
 18
18 -
19
-
20
-
21
-
22
-
23
-
24
-
25
-
26
-
27
-
28
-
29
-
30
-
31
-
32
-
33
-
34
-
35
-
36
-
37
-
38
-
39
-
40
-
41
-
42
-
43
-
44
-
45
-
46
-
47
-
48
-
49
-
50
-
51
-
52
-
53
-
54
-
55
-
56
-
57
-
58
-
59
-
60
-
61
-
62
-
63
-
64
-
65
-
66
-
67
-
68
 |
 |

DARDEN RESTAURANTS, INC. | 2015 ANNUAL REPORT 3
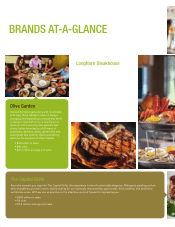
Innovative culinary platforms like Peak Season and
Chef’s Showcase allow LongHorn Steakhouse to oer
seasonally inspired avors.
of our remaining real estate assets to a new real estate investment
trust (REIT) that would be separated by a spin-off, split-off or similar
transaction, resulting in the REIT becoming an independent,
publicly traded company. This decision was reached after
conducting an extensive real estate evaluation process. While
a signicant amount of work remains, we believe this plan will
achieve a favorable outcome for all of Darden’s stakeholders
by strengthening our balance sheet while positioning two
companies to succeed in the future.
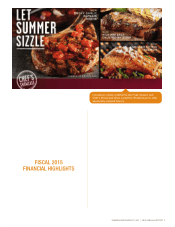
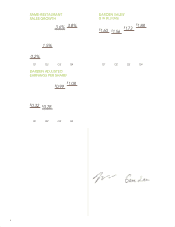
FISCAL 2015
FINANCIAL HIGHLIGHTS
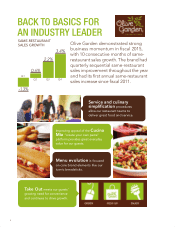
We are pleased with the progress we made to improve
performance and are well positioned to build on the momentum
we created in scal 2015.
• We had strong total sales growth in scal 2015, due to
combined same-restaurant sales growth of 2.4 percent, sales
from 33 net new restaurants and the 53rd week of operations.
Total sales from continuing operations were $6.76 billion,
a 7.6 percent increase from the $6.29 billion generated from
continuing operations in scal 2014.
• Adjusted diluted net earnings per share* from continuing
operations were $2.63 in scal 2015, a 54 percent increase
from adjusted diluted net earnings per share from continuing
operations of $1.71 in scal 2014. On a GAAP basis, diluted
net earnings per share from continuing operations were $1.51
in scal 2015 and $1.38 in scal 2014.
• During scal 2015, we implemented far-reaching improvements
for all elements of the Olive Garden business to reignite
same-restaurant sales growth and support margin expansion.
The Olive Garden Brand Renaissance is beginning to deliver
positive results, with scal 2015 representing the rst year of
positive same-restaurant sales since scal 2011. Olive Garden’s
total sales were $3.79 billion, up 4.0 percent from fiscal
2014. This reected average annual sales per restaurant of
$4.4 million, the addition of nine net new restaurants and
a U.S. same-restaurant sales increase of 1.3 percent.
* Represents a non-GAAP measure. A reconciliation of GAAP to non-GAAP
numbers can be found on page 61.