Red Lobster 2015 Annual Report Download - page 15
Download and view the complete annual report
Please find page 15 of the 2015 Red Lobster annual report below. You can navigate through the pages in the report by either clicking on the pages listed below, or by using the keyword search tool below to find specific information within the annual report.-
 1
1 -
2
-
3
-
4
-
 5
5 -
 6
6 -
 7
7 -
 8
8 -
 9
9 -
 10
10 -
 11
11 -
 12
12 -
 13
13 -
 14
14 -
 15
15 -
 16
16 -
 17
17 -
 18
18 -
 19
19 -
 20
20 -
 21
21 -
 22
22 -
 23
23 -
 24
24 -
 25
25 -
26
-
27
-
28
-
29
-
30
-
31
-
32
-
33
-
34
-
35
-
36
-
37
-
38
-
39
-
40
-
41
-
42
-
43
-
44
-
45
-
46
-
47
-
48
-
49
-
50
-
51
-
52
-
53
-
54
-
55
-
56
-
57
-
58
-
59
-
60
-
61
-
62
-
63
-
64
-
65
-
66
-
67
-
68
 |
 |

MANAGEMENT’S DISCUSSION AND ANALYSIS
OF FINANCIAL CONDITION AND RESULTS OF OPERATIONS
DARDEN
DARDEN RESTAURANTS, INC. | 2015 ANNUAL REPORT 11
We compute same-restaurant sales using restaurants open at least
16 months because this period is generally required for new restaurant sales
levels to normalize. Sales at newly opened restaurants generally do not make
a significant contribution to profitability in their initial months of operation due
to operating inefficiencies. Our sales and expenses can be impacted signifi-
cantly by the number and timing of new restaurant openings and closings,
relocations and remodeling of existing restaurants. Pre-opening expenses each
period reflect the costs associated with opening new restaurants in current and
future periods.
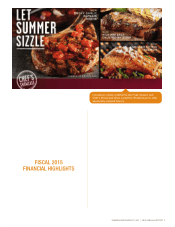
Fiscal 2015 Financial Highlights
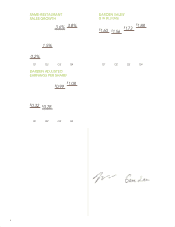
Our sales from continuing operations were $6.76 billion in fiscal 2015
compared to $6.29 billion in fiscal 2014. The 7.6 percent increase in sales
from continuing operations was driven by the addition of 33 net new company-
owned restaurants and a combined Darden same-restaurant sales increase
of 2.4 percent on a 52-week basis. Excluding the impact of the 53rd week
in fiscal 2015, sales from continuing operations increased approximately
5.6 percent.
Net earnings from continuing operations for fiscal 2015 were
$196.4 million ($1.51 per diluted share) compared with net earnings
from continuing operations for fiscal 2014 of $183.2 million ($1.38 per
diluted share). Net earnings from continuing operations for fiscal 2015
increased 7.2 percent and diluted net earnings per share from continuing
operations increased 9.4 percent compared with fiscal 2014. Excluding
the impact of the 53rd week in fiscal 2015, diluted net earnings per share
from continuing operations increased approximately 4.3 percent.
Our net earnings from discontinued operations were $513.1 million
($3.96 per diluted share) for fiscal 2015, compared with net earnings
from discontinued operations of $103.0 million ($0.77 per diluted share)
for fiscal 2014. When combined with results from continuing operations,
our diluted net earnings per share were $5.47 and $2.15 for fiscal 2015
and 2014, respectively.
Proposed REIT Transaction
On June 23, 2015, our Board of Directors announced approval of a strategic
real estate plan to pursue transfer of approximately 430 of our owned restaurant
properties into a real estate investment trust (REIT), with substantially all of
the REIT’s initial assets being leased back to Darden. We expect to complete
the REIT transaction during fiscal 2016. The REIT supplements the previously
announced sale-leaseback transactions of approximately 75 restaurant
properties and our corporate headquarters that were listed during the fourth
quarter of fiscal 2015. We expect to utilize the proceeds generated from these
transactions to pay down our long-term debt. We have conducted substantial
analysis of the feasibility of implementing a REIT transaction, however, a
significant amount of work remains and there can be no assurance we will
be able to successfully complete the transaction and establish a REIT. See
the subsection entitled “Liquidity and Capital Resources” for further details.
Outlook
We expect combined Darden same-restaurant sales increase in fiscal 2016
to range between 2.0 and 2.5 percent, with an increase in Olive Garden
same-restaurant sales between 1.5 percent and 2.5 percent, an increase
in LongHorn Steakhouse same-restaurant sales between 2.5 percent and
3.5 percent, and a blended same-restaurant sales increase for The Capital
Grille, Bahama Breeze, Seasons 52, Eddie V’s and Yard House of approximately
3.0 percent. Based on fiscal 2015 sales of $6.76 billion, we expect fiscal
2016 sales from continuing operations to increase between 2.0 percent
and 2.5 percent. We expect diluted net earnings per share from continuing
operations for fiscal 2016 to be above fiscal 2015 by between 20.0 percent
and 25.0 percent, excluding the impacts of the contemplated real estate
transactions. In fiscal 2016, we expect to add approximately 18–22 new
restaurants, and we expect capital expenditures incurred to build new
restaurants and remodel and maintain existing restaurants to be between
$230.0 million and $255.0 million.
In June 2015, we announced a quarterly dividend of $0.55 per share,
payable on August 3, 2015. Based on the $0.55 quarterly dividend declaration,
our expected annual dividend is $2.20 per share, which is consistent with
our fiscal 2015 annual dividend. Dividends are subject to the approval of our
Board of Directors and, accordingly, the timing and amount of our dividends
are subject to change.
There are significant risks and challenges that could impact our operations
and ability to increase sales and earnings. The restaurant industry is intensely
competitive and sensitive to economic cycles and other business factors,
including changes in consumer tastes and dietary habits. Other risks and
uncertainties are discussed and referenced in the subsection below entitled
“Forward-Looking Statements.”