Red Lobster 2015 Annual Report Download
Download and view the complete annual report
Please find the complete 2015 Red Lobster annual report below. You can navigate through the pages in the report by either clicking on the pages listed below, or by using the keyword search tool below to find specific information within the annual report.-
 1
1 -
 2
2 -
 3
3 -
 4
4 -
 5
5 -
 6
6 -
 7
7 -
 8
8 -
 9
9 -
 10
10 -
 11
11 -
 12
12 -
13
-
14
-
15
-
16
-
17
-
18
-
19
-
20
-
21
-
22
-
23
-
24
-
25
-
26
-
27
-
28
-
29
-
30
-
31
-
32
-
33
-
34
-
35
-
36
-
37
-
38
-
39
-
40
-
41
-
42
-
43
-
44
-
45
-
46
-
47
-
48
-
49
-
50
-
51
-
52
-
53
-
54
-
55
-
56
-
57
-
58
-
59
-
60
-
61
-
62
-
63
-
64
-
65
-
66
-
67
-
68
 |
 |

service our guests nd memorable.
2015 Annual Report
BACK TO BASICS
DARDEN RESTAURANTS, INC. 2015 ANNUAL REPORT
Table of contents
-
Page 1
2015 Annual Report BACK TO BASICS -
Page 2
... our menus to stay relevant to our guests. ATTENTIVE SERVICE Delivering the type of personalized service our guests find memorable. ENGAGING ATMOSPHERE Creating environments where our guests enjoy themselves and the occasion. INTEGRATED MARKETING Building smart and relevant programs that resonate... -
Page 3
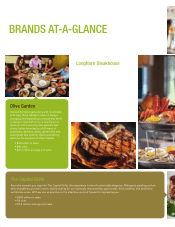
... new specials and classic Italian favorites to a full menu of appetizers, desserts, wines, gluten-free and new lighter fare options, there's something delicious for everyone at Olive Garden. • $3.8 billion in sales • 846 units • $4.5 million average unit sales • $1.5 billion in sales... -
Page 4
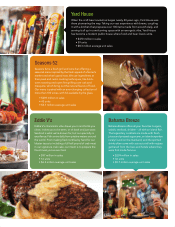
... a modern public house where food and beer lovers unite. • $470 million in sales • 59 units • $8.3 million average unit sales Seasons 52 Seasons 52 is a fresh grill and wine bar offering a seasonal menu inspired by the fresh appeal of a farmer's market and what's good now. We use ingredients... -
Page 5
... of a new Board of Directors. The new Board appointed a new Chairman of the Board and then selected a new Chief Executive Officer. This level of change in leadership is virtually unprecedented and provided our team with the clear mandate from shareholders to improve the Company, think differently... -
Page 6
... guest relationships and identify new opportunities to drive sales growth; and 3. Relentlessly driving operating efficiencies and continuous improvement while ensuring a sense of urgency, accountability and a performance-driven culture. INCREASING SHAREHOLDER VALUE While driving strong operational... -
Page 7
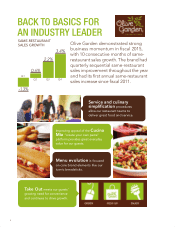
...deliver positive results, with fiscal 2015 representing the first year of positive same-restaurant sales since fiscal 2011. Olive Garden's total sales were $3.79 billion, up 4.0 percent from fiscal 2014. This reflected average annual sales per restaurant of $4.4 million, the addition of nine net new... -
Page 8
... allow our restaurant teams to deliver great food and service. Improving appeal of the Cucina Mia "create your own pasta" platform provides great everyday value for our guests. on core brand elements like our iconic breadsticks. Menu evolution is focused Take Out meets our guests' growing need... -
Page 9
... where food and beer lovers unite. of 1.8 percent. • We identified more than $100 million of annualized cost • LongHorn's total sales were $1.54 billion, up 11.6 percent from fiscal 2014. This reflected average annual sales per restaurant of $3.2 million, the addition of 16 net new restaurants... -
Page 10
...to Red Lobster and strategic action costs. A reconciliation of GAAP to non-GAAP numbers can be found on page 61. Q1 Q2 Q3 Q4 sales in fiscal 2015 to the lowest level since Darden became a public company 20 years ago. Darden benefits from a clear strategy and a culture of accountability that... -
Page 11
... Restaurant Group Todd Burrowes President LongHorn Steakhouse Danielle Kirgan Senior Vice President Chief Human Resources Officer Dave Lothrop Senior Vice President Corporate Controller Doug Milanes Senior Vice President Chief Supply Chain Officer DARDEN RESTAURANTS, INC. | 2015 ANNUAL REPORT... -
Page 12
... of Starboard Value LP. James P. Fogarty Former Chief Executive Officer of Orchard Brands, a multi-channel marketer of apparel and home products. Senior Advisor to Bluestem Group Inc. Cynthia T. Jamison Chairman of the Board of Directors of Tractor Supply Company, the largest operator of retail... -
Page 13
... Responsibilities 24 Management's Report on Internal Control Over Financial Reporting 25 Report of Independent Registered Public Accounting Firm on Internal Control Over Financial Reporting 26 Report of Independent Registered Public Accounting Firm DARDEN RESTAURANTS, INC. | 2015 ANNUAL REPORT 9 -
Page 14
... full-service dining segment of the restaurant industry. At May 31, 2015, we operated 1,534 restaurants through subsidiaries in the United States and Canada under the Olive Garden®, LongHorn Steakhouse®, The Capital Grille®, Yard House®, Bahama Breeze®, Seasons 52®, and Eddie V's Prime Seafood... -
Page 15
... for The Capital Grille, Bahama Breeze, Seasons 52, Eddie V's and Yard House of approximately 3.0 percent. Based on fiscal 2015 sales of $6.76 billion, we expect fiscal 2016 sales from continuing operations to increase between 2.0 percent and 2.5 percent. We expect diluted net earnings per share... -
Page 16
... earnings (1) Effective tax rate The following table details the number of company-owned restaurants currently reported in continuing operations, compared with the number open at the end of fiscal 2014 and the end of fiscal 2013. May 31, 2015 Olive Garden (1) LongHorn Steakhouse The Capital Grille... -
Page 17
...$ 78.4 2014 vs 2013 2015 vs 2014 Olive Garden LongHorn Steakhouse Yard House The Capital Grille Bahama Breeze Seasons 52 Eddie V's (1) Same-restaurant sales is a year-over-year comparison of each period's sales volumes for a 52-week year and is limited to restaurants open at least 16 months. The... -
Page 18
...remodel activities as compared to the prior year. • Net interest expense increased as a percent of sales primarily due to $91.3 million of debt breakage costs related to the retirement of $1.01 billion in principal of long-term debt. Fiscal 2014 Compared to Fiscal 2013: • Food and beverage costs... -
Page 19
... lives ranging from 7 to 40 years using the straight-line method. Leasehold improvements, which are reflected on our consolidated balance sheets as a component of buildings in land, buildings and equipment, net, are amortized over the lesser of the expected lease term, including cancelable option... -
Page 20
... operating results and cash flows that is discounted using a weighted-average cost of capital that reflects current market conditions. The projection uses management's best estimates of economic and market conditions over the projected period including growth rates in sales, costs and number... -
Page 21
... Capital Grille ($401.7 million), Eddie V's ($22.0 million) and Yard House ($369.2 million) reporting units, we also performed sensitivity analyses on our estimated fair value of these reporting units using the income approach. A key assumption in our fair value estimate is the weighted-average cost... -
Page 22
... OF FINANCIAL CONDITION AND RESULTS OF OPERATIONS DARDEN Unearned Revenues Unearned revenues represent our liability for gift cards that have been sold but not yet redeemed. We recognize sales from our gift cards when the gift card is redeemed by the customer. Although there are no expiration dates... -
Page 23
... by $2.0 million as a result of these rate adjustments. DARDEN RESTAURANTS, INC. | 2015 ANNUAL REPORT 19 Through our shelf registration statement on file with the SEC, depending on conditions prevailing in the public capital markets, we may issue unsecured debt securities from time to time in one... -
Page 24
... OF FINANCIAL CONDITION AND RESULTS OF OPERATIONS DARDEN A summary of our contractual obligations and commercial commitments at May 31, 2015, is as follows: Payments Due by Period 1-3 Years $ 904.6 359.3 14.7 11.9 64.4 5.5 $1,360.4 (in millions) Contractual Obligations Long-term debt (1) Operating... -
Page 25
... long-term rate of return on plan assets and expected health care cost trend rates. We set the discount rate assumption annually for each plan at its valuation date to reflect the yield of high-quality fixed-income debt instruments, with lives that approximate the maturity of the plan benefits. At... -
Page 26
MANAGEMENT'S DISCUSSION AND ANALYSIS OF FINANCIAL CONDITION AND RESULTS OF OPERATIONS DARDEN In the current year, we reduced our expected rate of return for investment of pension plan assets from 8.0 percent to 7.0 percent in connection with our current expectations for long-term returns and target ... -
Page 27
... inability or failure to recognize, respond to and effectively manage the accelerated impact of social media. Any of the risks described above or elsewhere in this report or our other filings with the SEC could have a material impact on our business, financial condition or results of operations. It... -
Page 28
... financial reporting was effective based on these criteria. The Company's independent registered public accounting firm KPMG LLP, has issued an audit report on the effectiveness of our internal control over financial reporting, which follows. Eugene I. Lee, Jr. President and Chief Executive Officer... -
Page 29
... with the standards of the Public Company Accounting Oversight Board (United States), the consolidated balance sheets of Darden Restaurants, Inc. and subsidiaries as of May 31, 2015 and May 25, 2014, and the related consolidated statements of earnings, comprehensive income, changes in stockholders... -
Page 30
...the three-year period ended May 31, 2015, in conformity with U.S. generally accepted accounting principles. We also have audited, in accordance with the standards of the Public Company Accounting Oversight Board (United States), Darden Restaurants, Inc.'s internal control over financial reporting as... -
Page 31
CONSOLIDATED STATEMENTS OF EARNINGS DARDEN (in millions, except per share data) May 31, 2015 Fiscal Year Ended May 25, 2014 May 26, 2013 Sales Costs and expenses: Food and beverage Restaurant labor Restaurant expenses Marketing expenses General and administrative expenses Depreciation and ... -
Page 32
...held for sale Total current assets Land, buildings and equipment, net Goodwill Trademarks Other assets Total assets Liabilities and Stockholders' Equity Current liabilities: Accounts payable Short-term debt Accrued payroll Accrued income taxes Other accrued taxes Unearned revenues Current portion of... -
Page 33
...receivable repayments Income tax benefits credited to equity Repurchases of common stock (1.0 shares) Issuance of stock under Employee Stock Purchase Plan and other plans (0.2 shares) Treasury shares retirement (159.3 shares) Balances at May 26, 2013 Net earnings Other comprehensive income Dividends... -
Page 34
... STATEMENTS OF CASH FLOWS DARDEN (in millions) May 31, 2015 Fiscal Year Ended May 25, 2014 May 26, 2013 Cash flows - operating activities Net earnings Earnings from discontinued operations, net of tax Adjustments to reconcile net earnings from continuing operations to cash flows: Depreciation... -
Page 35
... date of the financial statements, and the reported amounts of sales and expenses during the reporting period. Actual results could differ from those estimates. INVENTORIES Inventories consist of food and beverages and are valued at the lower of weighted-average cost or market. DARDEN RESTAURANTS... -
Page 36
... lives ranging from 7 to 40 years using the straight-line method. Leasehold improvements, which are reflected on our consolidated balance sheets as a component of buildings in land, buildings and equipment, net, are amortized over the lesser of the expected lease term, including cancelable option... -
Page 37
... stock price) as well as in the market capitalization of other companies in the restaurant industry, declines in sales at our restaurants, and significant adverse changes in the operating environment for the restaurant industry may result in future impairment. DARDEN RESTAURANTS, INC. | 2015 ANNUAL... -
Page 38
... reported. REVENUE RECOGNITION Sales, as presented in our consolidated statements of earnings, represents food and beverage product sold and is presented net of discounts, coupons, employee meals, and complimentary meals. Revenue from restaurant sales is recognized when food and beverage products... -
Page 39
...- Income Taxes for additional information. Income tax benefits credited to equity relate to tax benefits associated with amounts that are deductible for income tax purposes but do not affect earnings. These benefits are principally generated from employee exercises of non-qualified stock options and... -
Page 40
... DARDEN PRE-OPENING EXPENSES Non-capital expenditures associated with opening new restaurants are expensed as incurred. The following table presents the computation of basic and diluted net earnings per common share: Fiscal Year (in millions, except per share data) 2015 2014 2013 Earnings... -
Page 41
... to stand-alone Olive Garden restaurants. As of May 31, 2015, we received $2.08 billion in cash proceeds, net of transaction-related costs of approximately $29.3 million. During fiscal 2015, we recognized a pre-tax gain on the sale of Red Lobster of $837.0 million, which is included in earnings from... -
Page 42
....6 million. We expect to complete the remainder of the sale-leaseback transactions during fiscal 2016. NOTE 6 SEGMENT INFORMATION We manage our restaurant brands, Olive Garden, LongHorn Steakhouse, The Capital Grille, Yard House, Bahama Breeze, Seasons 52 and Eddie V's in North America as operating... -
Page 43
... include food and beverage costs, restaurant labor costs, restaurant expenses and marketing expenses. The following tables reconcile our segment results to our consolidated results reported in accordance with GAAP: (in millions) At May 31, 2015 and for the year ended Sales Restaurant and marketing... -
Page 44
... compensation plan Sales and other taxes Insurance-related Employee benefits Contingent proceeds - Red Lobster disposition Derivative liabilities Accrued interest Miscellaneous Total other current liabilities 7.125% debentures due February 2016 Variable-rate term loan (1.68% at May 31, 2015) due... -
Page 45
NOTES TO CONSOLIDATED FINANCIAL STATEMENTS DARDEN During fiscal 2015, with proceeds from the disposition of Red Lobster, we retired approximately $1.01 billion aggregate principal of long-term debt, comprised of $278.1 million aggregate principal of our 4.500 percent senior notes due 2021, $338.9 ... -
Page 46
...inherent in our business operations. By using these instruments, we expose ourselves, from time to time, to credit risk and market risk. Credit risk is the failure of the counterparty to perform under the terms of the derivative contract. When the fair value of a derivative contract is positive, the... -
Page 47
...administrative expenses. (4) Location of the gain (loss) reclassified from AOCI to earnings as well as the gain (loss) recognized in earnings for the ineffective portion of the hedge is food and beverage costs and general and administrative expenses. DARDEN RESTAURANTS, INC. | 2015 ANNUAL REPORT 43 -
Page 48
...Item in Fair Value Hedge Relationship Amount of Gain (Loss) Recognized in Earnings on Related Hedged Item Location of Gain (Loss) Recognized in Earnings on Related Hedged Item (in millions) 2015 Interest rate $2.0 Fiscal Year 2014 2013 $(0.3) $(1.3) Interest, net Debt 2015 Fiscal Year 2014 2013... -
Page 49
...scheduled maturities of our available-for-sale securities are as follows: (in millions) Cost $1.7 6.4 0.7 $8.8 Market Value $1.7 6.4 0.7 $8.8 (in millions) Cost $8.8 Available-for-sale securities Less than 1 year 1 to 3 years 3 to 5 years Total DARDEN RESTAURANTS, INC. | 2015 ANNUAL REPORT 45 -
Page 50
... stock having a value equal to two times the exercise price of the right. The rights are redeemable by our Board of Directors under certain circumstances and expire on June 23, 2016. The Rights Plan will not prohibit tender or exchange offers for all of the stock of the Company, as if no rights plan... -
Page 51
... Marketable Securities Unrealized Gains (Losses) on Derivatives Benefit Plan Accumulated Other Funding Position Comprehensive Income (Loss) Balances at May 26, 2013 Gain (loss) Reclassification realized in net earnings Balances at May 25, 2014 Gain (loss) Reclassification realized in net earnings... -
Page 52
... Year 2014 $117.5 (in millions) 2015 $142.8 2013 $112.6 Interest paid, net of amounts capitalized (1) (1) Interest paid in fiscal 2015 includes approximately $44.0 million of payments associated with the retirement of long-term debt. See Note 9 - Debt. NOTE 16 INCOME TAXES Total income tax... -
Page 53
... was as follows: Fiscal Year 2014 $0.4 (in millions) 2015 $1.1 2013 $0.5 Interest expense on unrecognized tax benefits At May 31, 2015, we had $0.7 million accrued for the payment of interest associated with unrecognized tax benefits. Net operating loss, credit and charitable contribution... -
Page 54
... related to the defined benefit pension plans and postretirement benefit plans, which are funded on a pay-as-you-go basis, were as follows: 2015 $0.4 1.1 Fiscal Year 2014 $0.4 0.9 2013 $2.4 0.8 (in millions) Defined benefit pension plans funding Postretirement benefit plan funding We expect... -
Page 55
... Benefit Plan May 31, 2015 May 25, 2014 (in millions) Components of the Consolidated Balance Sheets: Current liabilities Non-current liabilities Net amounts recognized Amounts Recognized in Accumulated Other Comprehensive Income (Loss), net of tax: Prior service (cost) credit Net actuarial gain... -
Page 56
... on amounts reported for defined benefit pension plans. A quarter percentage point change in the defined benefit plans' discount rate and the expected long-term rate of return on plan assets would increase or decrease earnings before income taxes by $0.0 million and $0.5 million, respectively. Due... -
Page 57
... 2015 Postretirement Benefit Plan 2014 2013 $ 0.7 1.4 - (0.1) - - - $ 2.0 $ 0.8 1.3 - (0.1) - - - $ 2.0 (in millions) Service cost Interest cost Expected return on plan assets Amortization of unrecognized prior service cost Recognized net actuarial loss Settlement loss recognized Curtailment gain... -
Page 58
...restrictions associated with these funds. (3) Emerging market commingled funds and developed market securities are comprised of investments in funds that purchase publicly traded common stock of non-U.S. companies for total return purposes. Funds are valued using a unit price or net asset value (NAV... -
Page 59
... in weighted-average common shares outstanding for purposes of calculating net earnings per share with the exception of those shares acquired under the Additional Loan which are accounted for in accordance with FASB ASC Subtopic 718-40, Employee Stock Ownership Plans. Fluctuations in our stock price... -
Page 60
... Year 2014 $19.3 0.9 12.3 2.5 1.8 1.9 $38.7 2013 $16.3 2.1 13.6 4.7 1.8 1.5 $40.0 (in millions) Stock options Restricted stock/restricted stock units Darden stock units Performance stock units (1) Employee stock purchase plan Director compensation program/other (1) The increase for fiscal 2015... -
Page 61
... cost related to Darden stock units granted under our incentive plans. This cost is expected to be recognized over a weighted-average period of 3.0 years. The total fair value of Darden stock units that vested during fiscal 2015 was $21.5 million. DARDEN RESTAURANTS, INC. | 2015 ANNUAL REPORT... -
Page 62
... plans. This cost is expected to be recognized over a weighted-average period of 1.7 years. The total fair value of performance stock units that vested in fiscal 2015 was $10.2 million. We maintain an Employee Stock Purchase Plan to provide eligible employees who have completed one year of service... -
Page 63
... Net earnings Dividends paid per share Stock price: High Low (1) The quarter ended May 31, 2015 consisted of 14 weeks while all other quarters consisted of 13 weeks. (2) The year ended May 31, 2015 consisted of 53 weeks while the year ended May 25, 2014 consisted of 52 weeks. DARDEN RESTAURANTS... -
Page 64
... operations basis. Accordingly, the activities related to Red Lobster, two closed company-owned synergy restaurants, Smokey Bones, Rocky River Grillhouse and the nine Bahama Breeze restaurants closed or sold in fiscal 2007 and 2008 have been excluded. (2) Fiscal year 2015 consisted of 53 weeks... -
Page 65
... DARDEN Reported to Adjusted Diluted Net Earnings Per Share Reconciliations Fiscal 2015 Diluted Net EPS from Continuing Operations Red Lobster-Related Shared Support Costs Other Strategic Action Plan Costs Debt Breakage Costs Asset Impairments and Other One-Time Costs Adjusted Diluted Net... -
Page 66
... our website at www.darden.com. Annual reports, SEC filings, press releases and other Company news are readily available on the website. Our website also includes corporate governance information, including our Corporate Governance Guidelines, Code of Business Conduct and Ethics, and board committee... -
Page 67
• • • dna kao revo gnillirg erfi nepo dna gnitsaor nevo .doof fo srovafl larutan eht tuo gnirb hcihw ,etiuqsem • • • .riafl dnalsi na htiw lla - nekcihc ,doofaes ,sdalas .suomaf edam tsrfi erew • • • .dah reve ev'uoy laem tsenfi • • • -
Page 68
1000 Darden Center Drive | Orlando, FL 32837 407-245-4000 | www.darden.com