Proctor and Gamble 2005 Annual Report Download - page 70
Download and view the complete annual report
Please find page 70 of the 2005 Proctor and Gamble annual report below. You can navigate through the pages in the report by either clicking on the pages listed below, or by using the keyword search tool below to find specific information within the annual report.-
 1
1 -
2
-
3
-
4
-
5
-
6
-
7
-
8
-
9
-
10
-
11
-
12
-
13
-
14
-
15
-
16
-
17
-
18
-
19
-
20
-
21
-
22
-
23
-
24
-
25
-
26
-
27
-
28
-
29
-
30
-
31
-
32
-
33
-
34
-
35
-
36
-
37
-
38
-
39
-
40
-
41
-
42
-
43
-
44
-
45
-
46
-
47
-
48
-
49
-
50
-
51
-
52
-
53
-
54
-
55
-
56
-
57
-
58
-
59
-
 60
60 -
 61
61 -
 62
62 -
 63
63 -
 64
64 -
 65
65 -
 66
66 -
 67
67 -
 68
68 -
 69
69 -
 70
70 -
 71
71 -
 72
72
 |
 |

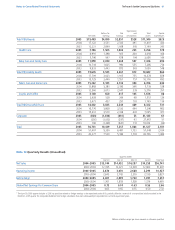
Management’sDiscussionandAnalysisTheProcter&GambleCompanyandSubsidiaries
66
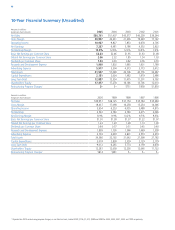
10-YearFinancialSummary(Unaudited)
Amountsinmillions
exceptpershareamounts 2004 2003 2002 2001
NetSales $51,407 $43,377 $40,238 $39,244
GrossMargin 26,331 21,236 19,249 17,142
OperatingIncome 9,827 7,853 6,678 4,736
NetEarnings 6,481 5,186 4,352 2,922
NetEarningsMargin 12.6% 12.0% 10.8% 7.4%
BasicNetEarningsperCommonShare $2.46 $1.95 $1.63 $1.08
DilutedNetEarningsperCommonShare 2.32 1.85 1.54 1.03
DividendsperCommonShare 0.93 0.82 0.76 0.70
ResearchandDevelopmentExpense 1,802 1,665 1,601 1,769
AdvertisingExpense 5,504 4,373 3,773 3,612
TotalAssets 57,048 43,706 40,776 34,387
CapitalExpenditures 2,024 1,482 1,679 2,486
Long-TermDebt 12,554 11,475 11,201 9,792
Shareholders’Equity 17,278 16,186 13,706 12,010
RestructuringProgramCharges1 $– $751 $958 $1,850
1 Organization2005restructuringprogramcharges,onanafter-taxbasis,totaled$538,$706,$1,475,$688and$285for2003,2002,2001,2000and1999respectively.
Amountsinmillions
exceptpershareamounts 2000 1999 1998 1997 1996
NetSales $39,951 $38,125 $37,154 $35,764 $35,284
GrossMargin 18,437 17,098 16,258 15,254 14,346
OperatingIncome 5,954 6,253 6,055 5,488 4,815
NetEarnings 3,542 3,763 3,780 3,415 3,046
NetEarningsMargin 8.9% 9.9% 10.2% 9.5% 8.6%
BasicNetEarningsperCommonShare $1.30 $1.38 $1.37 $1.22 $1.07
DilutedNetEarningsperCommonShare 1.23 1.29 1.28 1.14 1.00
DividendsperCommonShare 0.64 0.57 0.51 0.45 0.40
ResearchandDevelopmentExpense 1,899 1,726 1,546 1,469 1,399
AdvertisingExpense 3,793 3,639 3,801 3,574 3,374
TotalAssets 34,366 32,192 31,042 27,598 27,762
CapitalExpenditures 3,018 2,828 2,559 2,129 2,179
Long-TermDebt 9,012 6,265 5,774 4,159 4,678
Shareholders’Equity 12,287 12,058 12,236 12,046 11,722
RestructuringProgramCharges1$814 $481 $– $– $–