Proctor and Gamble 2005 Annual Report Download - page 61
Download and view the complete annual report
Please find page 61 of the 2005 Proctor and Gamble annual report below. You can navigate through the pages in the report by either clicking on the pages listed below, or by using the keyword search tool below to find specific information within the annual report.-
 1
1 -
2
-
3
-
4
-
5
-
6
-
7
-
8
-
9
-
10
-
11
-
12
-
13
-
14
-
15
-
16
-
17
-
18
-
19
-
20
-
21
-
22
-
23
-
24
-
25
-
26
-
27
-
28
-
29
-
30
-
31
-
32
-
33
-
34
-
35
-
36
-
37
-
38
-
39
-
40
-
41
-
42
-
43
-
44
-
45
-
46
-
47
-
48
-
49
-
50
-
 51
51 -
 52
52 -
 53
53 -
 54
54 -
 55
55 -
 56
56 -
 57
57 -
 58
58 -
 59
59 -
 60
60 -
 61
61 -
 62
62 -
 63
63 -
 64
64 -
 65
65 -
 66
66 -
 67
67 -
 68
68 -
 69
69 -
 70
70 -
 71
71 -
72
 |
 |

Management’sDiscussionandAnalysis TheProcter&GambleCompanyandSubsidiaries 57
offavorablereturnsontheCompany’sstockrelativetobroadermarket
indices(e.g.,S&P500).
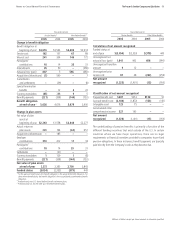
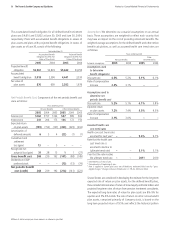
Assumedhealthcarecosttrendratescouldhaveasignificanteffecton
theamountsreportedfortheotherretireebenefitplans.Aone-percentage
pointchangeinassumedhealthcarecosttrendrateswouldhavethe
followingeffects:
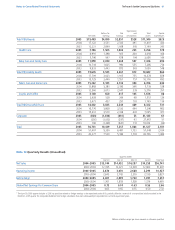
PlanAssets.OurtargetassetallocationfortheyearendingJune30,
2006andactualassetallocationbyassetcategoryasofJune30,2005,
and2004,areasfollows:
Ourinvestmentobjectivefordefinedbenefitplanassetsistomeetthe
plans’benefitobligations,whileminimizingthepotentialforfuture
requiredCompanyplancontributions.Theinvestmentstrategiesfocus
onassetclassdiversification,liquiditytomeetbenefitpaymentsand
anappropriatebalanceoflong-terminvestmentreturnandrisk.Target
rangesforassetallocationsaredeterminedbymatchingtheactuarial
projectionsoftheplan’sfutureliabilitiesandbenefitpaymentswith
expectedlong-termratesofreturnontheassets,takingintoaccount
investmentreturnvolatilityandcorrelationsacrossassetclasses.Plan
assetsarediversifiedacrossseveralinvestmentmanagersandaregenerally
investedinliquidfundsthatareselectedtotrackbroadmarketequity
andbondindices.Investmentriskiscarefullycontrolledwithplan
assetsrebalancedtotargetallocationsonaperiodicbasisand
continualmonitoringofinvestmentmanagersperformancerelativeto
theinvestmentguidelinesestablishedwitheachinvestmentmanager.
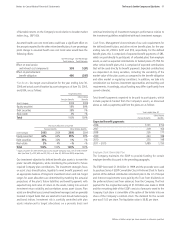
CashFlows.
Management’sbestestimateofourcashrequirementsfor
thedefinedbenefitplansandotherretireebenefitplansfortheyear
endingJune30,2006is$241and$18,respectively.Forthedefined
benefitplans,thisiscomprisedofexpectedbenefitpaymentsof$83,
whicharepaiddirectlytoparticipantsofunfundedplansfromemployer
assets,aswellasexpectedcontributionstofundedplansof$158.For
otherretireebenefitplans,thisiscomprisedofexpectedcontributions
thatwillbeuseddirectlyforbenefitpayments.Expectedcontributions
aredependentonmanyvariables,includingthevariabilityofthe
marketvalueoftheplanassetsascomparedtothebenefitobligation
andothermarketorregulatoryconditions.Inaddition,wetakeinto
considerationourbusinessinvestmentopportunitiesandresultingcash
requirements.Accordingly,actualfundingmaydiffersignificantlyfrom
currentestimates.
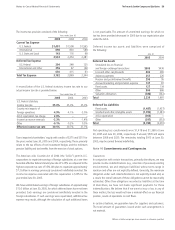
Totalbenefitpaymentsexpectedtobepaidtoparticipants,which
includepaymentsfundedfromtheCompany’sassets,asdiscussed
above,aswellaspaymentspaidfromtheplansareasfollows:
EmployeeStockOwnershipPlan
TheCompanymaintainstheESOPtoprovidefundingforcertain
employeebenefitsdiscussedintheprecedingparagraphs.
TheESOPborrowed$1.00billionin1989andtheproceedswereused
topurchaseSeriesAESOPConvertibleClassAPreferredStocktofunda
portionofthedefinedcontributionretirementplanintheU.S.Principal
andinterestrequirementswerepaidbytheTrustfromdividendson
thepreferredsharesandfromadvancesfromtheCompany.Thefinal
paymentfortheoriginalborrowingof$1.00billionwasmadein2004
andtheremainingdebtoftheESOPconsistsofamountsowedtothe
Company.Eachshareisconvertibleattheoptionoftheholderintoone
shareoftheCompany’scommonstock.Thedividendforthecurrent
yearwas$1.03pershare.Theliquidationvalueis$6.82pershare.
NotestoConsolidatedFinancialStatements TheProcter&GambleCompanyandSubsidiaries
Millionsofdollarsexceptpershareamountsorotherwisespecified.
TargetAllocation
OtherRetiree
PensionBenefits Benefits
AssetCategory
2006 2006
Equitysecurities1
58% 99%
Debtsecurities
38% 1%
Realestate
4% –%
100% 100%
PlanAssetAllocationatJune30
PensionBenefits OtherRetireeBenefits
AssetCategory
20042004
Equitysecurities1
64% 99%
Debtsecurities
32% 1%
Realestate
4% –%
100% 100%
1 EquitysecuritiesforotherretireeplanassetsincludeCompanystock,netofSeriesBESOP
debt(seeNote5),of$2,604and$2,744,asofJune30,2005and2004,respectively.
One-Percentage One-Percentage
PointIncrease PointDecrease
Effectontotalservice
andinterestcostcomponents
Effectonpostretirement
benefitobligation
YearsendedJune30
OtherRetiree
PensionBenefits Benefits
2006 $191 $152
2007 209 164
2008 226 177
2009 243 188
2010 255 198
2011–2015 1,489 1,150