Proctor and Gamble 2005 Annual Report Download - page 36
Download and view the complete annual report
Please find page 36 of the 2005 Proctor and Gamble annual report below. You can navigate through the pages in the report by either clicking on the pages listed below, or by using the keyword search tool below to find specific information within the annual report.-
 1
1 -
2
-
3
-
4
-
5
-
6
-
7
-
8
-
9
-
10
-
11
-
12
-
13
-
14
-
15
-
16
-
17
-
18
-
19
-
20
-
21
-
22
-
23
-
24
-
25
-
 26
26 -
 27
27 -
 28
28 -
 29
29 -
 30
30 -
 31
31 -
 32
32 -
 33
33 -
 34
34 -
 35
35 -
 36
36 -
 37
37 -
 38
38 -
 39
39 -
 40
40 -
 41
41 -
 42
42 -
 43
43 -
 44
44 -
 45
45 -
 46
46 -
47
-
48
-
49
-
50
-
51
-
52
-
53
-
54
-
55
-
56
-
57
-
58
-
59
-
60
-
61
-
62
-
63
-
64
-
65
-
66
-
67
-
68
-
69
-
70
-
71
-
72
 |
 |
Management’sDiscussionandAnalysisTheProcter&GambleCompanyandSubsidiaries
32
basispointscomparedtotheprioryear.Themarginincreased
primarily due to the scale benefits of volume growth,cost
reductionprogramsandtheimpactsoftheCompany’sincreased
ownershipoftheChinaoperationandtheDominationandProfit
TransferAgreementwithWella.Thesemarginbenefitswerepartially
offsetbymarketingspendingtosupportinitiatives,includingthose
discussedabove.
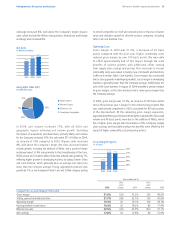
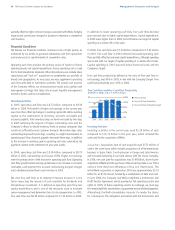
In2004,P&GBeautyunitvolumeincreased37%.Excludingthe
impactoftheWellaacquisition,unitvolumeincreased10%behind
broad-basedgrowthintheHairCare,PersonalBeautyCareand
Feminine Care businesses. Net sales increased 40% to
$17.12 billion. Sales growth included a positive foreign
exchange impactof4%, partiallyoffset by negativepricing
of 1%. Pricing includes actions to support the Hair Care,
ColorantsandCosmeticsbusinessesinNorthAmericaandthe
FeminineCarebusinessinWesternEurope.Overall,P&GBeauty
marketshareincreased,assalesgrowthout-pacedmarketgrowth
inkeycategoriesincludingSkinCare,FeminineCareandHairCare.
Netearningsincreased20%to$2.33billion.Volumebenefits,
includingtheadditionofWella,andlowermaterialcostswere
partiallyoffsetbymarketinginvestmentstosupportproduct
initiativesandthebasebusiness.Earningsmargindecreaseddueto
theimpactofthehigherSG&AexpenseratioforWella.TheWella
acquisitionwasaccretivetoP&GBeautyearningsandhadno
materialimpactonCompanyearningsafterincludinginterest
expense,whichisincludedinCorporate.In2003,P&GBeautynetsales
were$12.22billionandnetearningswere$1.94billion.
P&GFamilyHealth
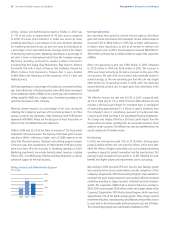
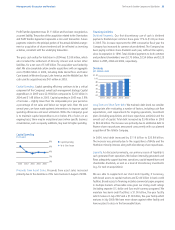
HealthCare.HealthCareunitvolumein2005increased10%
behinddouble-digitgrowthofPrilosecOTC,Actonelanddeveloping
markets.OralCarepostedmid-singledigitvolumegrowthglobally
despiteachallengingcompetitiveenvironment.Developingmarket
volumeforOralCarewasupdouble-digits,whiledevelopedmarket
volumedecreaseddueprimarilytoacontractionoftheU.S.tooth
whiteningmarket.Netsalesincreased11%to$7.79billionaided
byapositive2%foreignexchangeimpact.PricinginPetHealthand
NutritionandPharmaceuticalsadded1%tosales,whileproduct
mixreducedsalesby2%duetotheshiftofMacrobidbrandedsales
togenericsalesandhigherrelativegrowthindevelopingmarkets.
HealthCare’snetearningswere$1.00billion,anincreaseof8%
againstabaseperiodwhereearningsincreased36%.Earnings
increasedprimarilybehindvolumegrowth.After-taxearnings
margindeclinedabout40basispointsyear-over-yeardue,inpart,
toproductmiximpactsoflowervolumeinMacrobidandCrest
Whitestrips,bothofwhichhavehighermarginsthanthebalanceof
theHealthCarebusiness.Earningswerealsonegativelyimpactedby
ahigherroyaltyexpenserateforPrilosecOTC,highercommoditycosts
andmarketinginvestmentsinsupportofinitiatives.
In2004,HealthCareunitvolumeincreased18%.Allcategoriesgrew
volume,withdouble-digitgainsinthePharmaceutical,PersonalHealth
CareandOralCarebusinesses,aswellassolidgrowthinPetHealth
andNutrition.Netsalesincreased21%to$6.99billion.Foreign
exchangeincreasedsales3%.Netearningsincreased36%to$925
millionprimarilydrivenbysalesgrowthbehindinitiativesandmargin
expansionduetoproductmix,manufacturingcostsavingsandlower
overheadspendingasapercentageofsales.Mix-drivenmargin
expansionwasnegativelyimpactedbyincreasedmarketingspending
tosupportinitiativesandthebasebusiness.In2003,HealthCarenet
saleswere$5.80billionandnetearningswere$678million.
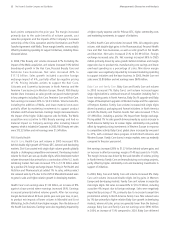
BabyCareandFamilyCare.BabyCareandFamilyCareunitvolume
in2005increased7%.BabyCare’sunitvolumeincreasedupper
single-digitsbehindacontinuedstreamofinnovationincludingFeel’n
LearntrainingpantsinNorthAmerica,BabyDryfitupgradeandBaby
StagesofDevelopmentupgradesinWesternEuropeandtheexpansion
ofPampersKandoo.FamilyCarevolumeincreasedmid-singledigits
drivenbyproduct,packagingandformatinitiativesinNorthAmerica
onboththeBountyandCharminbrands.Netsalesincreased11%to
$11.89billion,includingapositive3%impactfromforeignexchange.
Pricingadded1%tosalesgrowthdrivenprimarilybyapriceincreasein
NorthAmericaFamilyCaretorecoverhighercommoditycosts,partially
offsetbytargetedpricinginvestmentsinWesternEuropeinresponse
tocompetitiveactivity.BabyCare’sglobalshareincreasedbyonepoint
to37%,withcontinuedshareprogressinbothNorthAmericaand
WesternEurope.FamilyCaresharesinmajormarketswereupmodestly
comparedtotheprioryearperiod.
Netearningsincreased28%to$1.27billionbehindvolumegainsand
anincreaseinafter-taxearningsmarginof140basispointsto10.6%.
Themarginincreasewasdrivenbythescalebenefitsofvolume,pricing
inNorthAmericaFamilyCareandmanufacturingcostsavingsprojects,
partlyoffsetbyhighercommoditycostsandmarketinginvestmentsin
supportofinitiatives.
In2004,BabyCareandFamilyCareunitvolumeincreased6%.Baby
Careunitvolumeincreaseddouble-digitsledbygainsinWestern
Europeanddevelopingmarkets.FamilyCareunitvolumeincreasedby
mid-singledigits.Netsalesincreased8%to$10.72billion,including
apositive4%impactduetoforeignexchange.Saleswerenegatively
impactedbypricingof1%,primarilyduetoincreasedcompetitive
promotionalactivityinNorthAmericaFamilyCare.Mixreducedsales
by1%dueprimarilytohigherrelativeBabyCaregrowthindeveloping
markets,whereunitsalespricesaregenerallylowerthanthebusiness
average.BabyCareandFamilyCarenetearningswere$990million
in2004,anincreaseof13%comparedto2003.BabyCaredelivered