Proctor and Gamble 2005 Annual Report Download - page 38
Download and view the complete annual report
Please find page 38 of the 2005 Proctor and Gamble annual report below. You can navigate through the pages in the report by either clicking on the pages listed below, or by using the keyword search tool below to find specific information within the annual report.-
 1
1 -
2
-
3
-
4
-
5
-
6
-
7
-
8
-
9
-
10
-
11
-
12
-
13
-
14
-
15
-
16
-
17
-
18
-
19
-
20
-
21
-
22
-
23
-
24
-
25
-
26
-
27
-
 28
28 -
 29
29 -
 30
30 -
 31
31 -
 32
32 -
 33
33 -
 34
34 -
 35
35 -
 36
36 -
 37
37 -
 38
38 -
 39
39 -
 40
40 -
 41
41 -
 42
42 -
 43
43 -
 44
44 -
 45
45 -
 46
46 -
 47
47 -
 48
48 -
49
-
50
-
51
-
52
-
53
-
54
-
55
-
56
-
57
-
58
-
59
-
60
-
61
-
62
-
63
-
64
-
65
-
66
-
67
-
68
-
69
-
70
-
71
-
72
 |
 |
Management’sDiscussionandAnalysisTheProcter&GambleCompanyandSubsidiaries
34
partiallyoffsetbyhigherinterestchargesassociatedwithWella,hedging
impactsandcurrentyearchargesforprojectstomaintainacompetitive
coststructure.
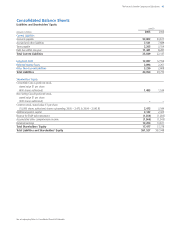
FinancialCondition
Webelieveourfinancialconditioncontinuestobeofhighquality,as
evidencedbyourabilitytogeneratesubstantialcashfromoperations
andreadyaccesstocapitalmarketsatcompetitiverates.
Operatingcashflowprovidestheprimarysourceoffundstofinance
operatingneedsandcapitalexpenditures.Excessoperatingcashisused
firsttofundshareholderdividends.Otherdiscretionaryusesincludeshare
repurchasesand“tack-on”acquisitionstocomplementourportfolioof
brandsandgeographies.Asnecessary,wemaysupplementoperating
cashflowwithdebttofundtheseactivities.Theoverallcashposition
oftheCompanyreflectsourstrongbusinessresultsandaglobalcash
managementstrategythattakesintoaccountliquiditymanagement,
economicfactorsandtaxconsiderations.
OperatingActivities
In2005,operatingcashflowwas$8.72billioncomparedto$9.36
billionin2004.Thebenefitofhighernetearningsinthecurrentyear
wasmorethanoffsetbychangesinworkingcapital.Wedefineworking
capitalasthecombinationofinventory,accountsreceivableand
accountspayable.Totalinventorydaysonhandincreasedbytwodays
in2005reflectingtheimpactsofhighercommoditycostsandthe
Company’seffortstorebuildinventorylevelsinproductcategoriesthat
couldnotsufficientlymeetcustomerdemand.Receivabledayssales
outstandingimprovedbytwodays,resultinginaslightimprovementto
operatingcashflow.Accountspayabledecreasedthreedays.Inaddition
totheincreaseinworkingcapital,operatingcashwasreducedbytax
paymentsrelatedtothesettlementofprioryearaudits.
In2004,operatingcashflowwas$9.36billioncomparedto$8.70
billionin2003,representinganincreaseof8%.Highernetearnings
weretheprimarydriveroftheincreaseinoperatingcashflow.Operating
cashflowgrowthtrailedearningsgrowthduetoanincreaseinaccounts
receivable,cashpaymentsforaccruedrestructuringprogramcharges
andadividendreceivedfromajointventurein2003.
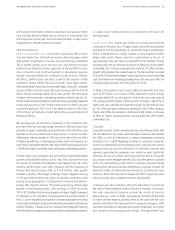
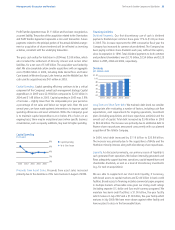
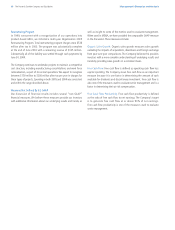
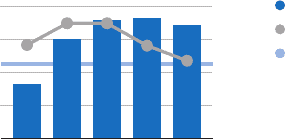
Weviewfreecashflowasanimportantmeasurebecauseitisone
factorimpactingtheamountofcashavailablefordividendsand
discretionaryinvestment.Itisdefinedasoperatingcashflowless
capitalexpendituresandisoneofthemeasuresusedtoevaluate
seniormanagementanddeterminetheirat-riskcompensation.In2005,
freecashflowwas$6.54billioncomparedto$7.34billionin2004.
Inadditiontoloweroperatingcashflow,freecashflowdeclined
year-over-yearduetohighercapitalexpenditures.Capitalexpenditures
in2005werehigherthanin2004,butstillbelowourtargetofcapital
spendingatorbelow4%ofnetsales.
In2004,freecashflowwas$7.34billioncomparedto$7.22billion
in2003.Freecashflowin2004reflectedincreasedoperatingcash
flow,partiallyoffsetbyincreasedcapitalexpenditures,althoughspending
wasin-linewithourtargetofcapitalspendingatorbelow4%ofsales.
Capitalspendingin2003waswellbelowhistoricallevelsandthe
Company'starget.
Freecashflowproductivity,definedastheratiooffreecashflowto
netearnings,was90%in2005,in-linewiththeCompany’starget.Free
cashflowproductivitywas113%in2004.
InvestingActivities
Investingactivitiesinthecurrentyearused$2.34billionofcash
comparedto$10.14billionintheprioryear,whichincludedthe
cashusedfortheacquisitionofWella.
Acquisitions.Acquisitions(netofcashacquired)used$572millionof
cashinthecurrentyearwhichincludesacquisitionsofaPharmaceuticals
businessinSpain,FabricCarebusinessesinEuropeandLatinAmerica
andincreasedownershipinourGladventurewithTheCloroxCompany.
In2004,netcashusedforacquisitionswas$7.48billion,drivenbythe
acquisitionofWellaandthepurchaseoftheremainingstakeinourChina
venture fromHutchisonWhampoa China Ltd.(Hutchison).The
initialWellaacquisitioninSeptember2003wasapproximately$5.10
billionforan81%interest,fundedbyacombinationofdebtandcash.
InJune2004,theCompanyandWellacompletedaDominationand
ProfitTransferAgreement,whichprovidedusfulloperatingcontroland
rightsto100%offutureoperatingresults.Inexchange,wemustpay
theremainingWellashareholdersaguaranteedannualdividendpayment.
Alternatively,theWellashareholdersmayelecttotendertheshares
forafixedprice.TheobligationassociatedwiththeDominationand
Free Cash Flow and Free Cash Flow Productivity
(in billions of dollars, and as % of net earnings)
2002 20052003 20042001
0%
160%
120%
80%
40%
0
$8
4
2
6
Free Cash Flow
Free Cash Flow Productivity
Free Cash Flow Productivity Target