Porsche 2009 Annual Report Download - page 212
Download and view the complete annual report
Please find page 212 of the 2009 Porsche annual report below. You can navigate through the pages in the report by either clicking on the pages listed below, or by using the keyword search tool below to find specific information within the annual report.-
 1
1 -
2
-
3
-
4
-
5
-
6
-
7
-
8
-
9
-
10
-
11
-
12
-
13
-
14
-
15
-
16
-
17
-
18
-
19
-
20
-
21
-
22
-
23
-
24
-
25
-
26
-
27
-
28
-
29
-
30
-
31
-
32
-
33
-
34
-
35
-
36
-
37
-
38
-
39
-
40
-
41
-
42
-
43
-
44
-
45
-
46
-
47
-
48
-
49
-
50
-
51
-
52
-
53
-
54
-
55
-
56
-
57
-
58
-
59
-
60
-
61
-
62
-
63
-
64
-
65
-
66
-
67
-
68
-
69
-
70
-
71
-
72
-
73
-
74
-
75
-
76
-
77
-
78
-
79
-
80
-
81
-
82
-
83
-
84
-
85
-
86
-
87
-
88
-
89
-
90
-
91
-
92
-
93
-
94
-
95
-
96
-
97
-
98
-
99
-
100
-
101
-
102
-
103
-
104
-
105
-
106
-
107
-
108
-
109
-
110
-
111
-
112
-
113
-
114
-
115
-
116
-
117
-
118
-
119
-
120
-
121
-
122
-
123
-
124
-
125
-
126
-
127
-
128
-
129
-
130
-
131
-
132
-
133
-
134
-
135
-
136
-
137
-
138
-
139
-
140
-
141
-
142
-
143
-
144
-
145
-
146
-
147
-
148
-
149
-
150
-
151
-
152
-
153
-
154
-
155
-
156
-
157
-
158
-
159
-
160
-
161
-
162
-
163
-
164
-
165
-
166
-
167
-
168
-
169
-
170
-
171
-
172
-
173
-
174
-
175
-
176
-
177
-
178
-
179
-
180
-
181
-
182
-
183
-
184
-
185
-
186
-
187
-
188
-
189
-
190
-
191
-
192
-
193
-
194
-
195
-
196
-
197
-
198
-
199
-
200
-
201
-
 202
202 -
 203
203 -
 204
204 -
 205
205 -
 206
206 -
 207
207 -
 208
208 -
 209
209 -
 210
210 -
 211
211 -
 212
212 -
 213
213 -
 214
214 -
 215
215 -
 216
216 -
 217
217 -
 218
218 -
 219
219 -
 220
220 -
 221
221 -
 222
222 -
223
-
224
-
225
-
226
-
227
-
228
-
229
-
230
-
231
-
232
-
233
-
234
-
235
-
236
-
237
-
238
-
239
-
240
-
241
-
242
-
243
-
244
-
245
-
246
-
247
-
248
-
249
-
250
-
251
-
252
-
253
-
254
-
255
-
256
-
257
-
258
-
259
-
260
-
261
-
262
-
263
-
264
-
265
-
266
-
267
-
268
-
269
-
270
-
271
-
272
-
273
-
274
-
275
 |
 |

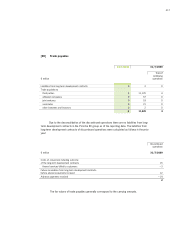
212 Financials
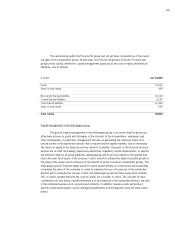
In the prior year the effects on the service cost and interest cost in discontinued operations
of a one percentage point increase or decrease in the assumed medical cost increase rate when
calculating the obligations were immaterial. The discontinued operations’ obligation for medical care
would have increased or decreased by €6 million in the prior year.
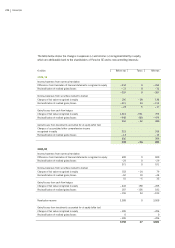
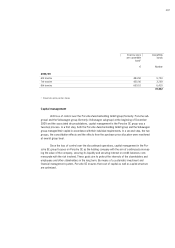
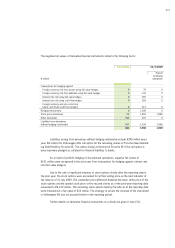
Amounts recognized in profit or loss break down as follows:
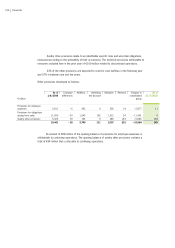
The rate for the expected long-term return on plan assets of discontinued operations is ba-
sed on the long-term returns actually generated for the portfolios, historical overall market returns
and a forecast of expected returns on the securities classes held in the portfolio. The forecasts are
based on the rate of return expected by actuaries and experts from the investment industry. The
expected remaining service period is used as the investment horizon.
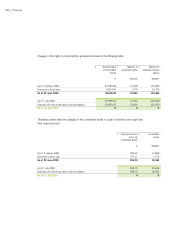
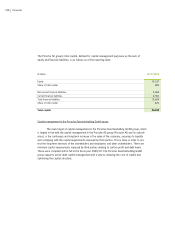
The table below presents the changes in the present value of the pension obligations and
the plan assets at market values.
Continuing Discontinued Reclassification Total
€ million operations operations acc. to IFRS 5
2009/10
Current service cost 1 183 – 183 1
Interest expenses 0 383 – 383 0
Expected return on plan assets 0 – 85 85 0
Net actuarial gain (–)/loss (+) 0 0 0 0
Past service cost 0 – 46 46 0
Gains (–) and losses (+) as a result of application of the
limit according to IAS 19.58b 0 – 22 22 0
Net benefit expense 1 413 – 413 1
2008/09
Current service cost 1 201 – 201 1
Interest expenses 0 500 – 500 0
Expected return on plan assets 0 – 103 103 0
Net actuarial gain (–)/loss (+) 0 – 1 1 0
Past service cost – 1 – 50 50 – 1
Gains (–) and losses (+) as a result of application of the
limit according to IAS 19.58b 0 – 30 30 0
Net benefit expense 0 517 – 517 0