Porsche 2009 Annual Report Download - page 193
Download and view the complete annual report
Please find page 193 of the 2009 Porsche annual report below. You can navigate through the pages in the report by either clicking on the pages listed below, or by using the keyword search tool below to find specific information within the annual report.-
 1
1 -
2
-
3
-
4
-
5
-
6
-
7
-
8
-
9
-
10
-
11
-
12
-
13
-
14
-
15
-
16
-
17
-
18
-
19
-
20
-
21
-
22
-
23
-
24
-
25
-
26
-
27
-
28
-
29
-
30
-
31
-
32
-
33
-
34
-
35
-
36
-
37
-
38
-
39
-
40
-
41
-
42
-
43
-
44
-
45
-
46
-
47
-
48
-
49
-
50
-
51
-
52
-
53
-
54
-
55
-
56
-
57
-
58
-
59
-
60
-
61
-
62
-
63
-
64
-
65
-
66
-
67
-
68
-
69
-
70
-
71
-
72
-
73
-
74
-
75
-
76
-
77
-
78
-
79
-
80
-
81
-
82
-
83
-
84
-
85
-
86
-
87
-
88
-
89
-
90
-
91
-
92
-
93
-
94
-
95
-
96
-
97
-
98
-
99
-
100
-
101
-
102
-
103
-
104
-
105
-
106
-
107
-
108
-
109
-
110
-
111
-
112
-
113
-
114
-
115
-
116
-
117
-
118
-
119
-
120
-
121
-
122
-
123
-
124
-
125
-
126
-
127
-
128
-
129
-
130
-
131
-
132
-
133
-
134
-
135
-
136
-
137
-
138
-
139
-
140
-
141
-
142
-
143
-
144
-
145
-
146
-
147
-
148
-
149
-
150
-
151
-
152
-
153
-
154
-
155
-
156
-
157
-
158
-
159
-
160
-
161
-
162
-
163
-
164
-
165
-
166
-
167
-
168
-
169
-
170
-
171
-
172
-
173
-
174
-
175
-
176
-
177
-
178
-
179
-
180
-
181
-
182
-
 183
183 -
 184
184 -
 185
185 -
 186
186 -
 187
187 -
 188
188 -
 189
189 -
 190
190 -
 191
191 -
 192
192 -
 193
193 -
 194
194 -
 195
195 -
 196
196 -
 197
197 -
 198
198 -
 199
199 -
 200
200 -
 201
201 -
 202
202 -
 203
203 -
204
-
205
-
206
-
207
-
208
-
209
-
210
-
211
-
212
-
213
-
214
-
215
-
216
-
217
-
218
-
219
-
220
-
221
-
222
-
223
-
224
-
225
-
226
-
227
-
228
-
229
-
230
-
231
-
232
-
233
-
234
-
235
-
236
-
237
-
238
-
239
-
240
-
241
-
242
-
243
-
244
-
245
-
246
-
247
-
248
-
249
-
250
-
251
-
252
-
253
-
254
-
255
-
256
-
257
-
258
-
259
-
260
-
261
-
262
-
263
-
264
-
265
-
266
-
267
-
268
-
269
-
270
-
271
-
272
-
273
-
274
-
275
 |
 |

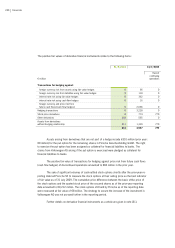
193
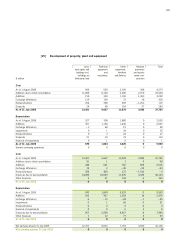
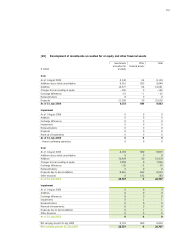
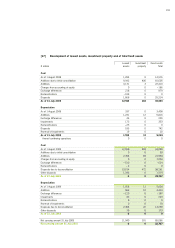
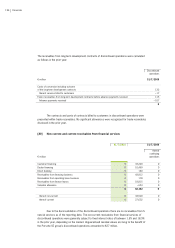
[17] Development of leased assets, investment property and of total fixed assets
Leased Investment Fixed assets
€ million assets property Total
Cost
As of 1 August 2008 1,284 0 14,576
Additions due to initial consolidation 9,942 400 81,605
Additions 3,131 3 22,410
Changes from accounting at equity 0 0 – 166
Exchange differences 218 0 879
Reclassifications – 109 0 0
Disposals 1,868 0 25,214
As of 31 July 2009 12,598 403 94,090
Depreciation
As of 1 August 2008 337 0 3,408
Additions 1,231 12 5,816
Exchange differences 46 0 209
Impairments 173 0 353
Reclassifications – 25 0 0
Disposals 185 0 742
Reversal of impairments 19 0 20
As of 31 July 2009 1,558 12 9,024
thereof continuing operations 0 0 0
Cost
As of 1 August 2009 12,598 403 94,090
Additions due to initial consolidation 0 0 99
Additions 2,354 69 21,964
Changes from accounting at equity 0 0 7,003
Exchange differences – 510 0 – 614
Reclassifications – 2 0 0
Disposals due to deconsolidation 13,194 472 98,261
Other disposals 1,246 0 1,574
As of 31 July 2010 0 0 22,707
Depreciation
As of 1 August 2009 1,558 12 9,024
Additions 962 10 4,419
Exchange differences – 120 0 – 187
Impairments 43 0 223
Reclassifications 0 0 0
Reversal of impairments 0 0 10
Disposals due to deconsolidation 2,364 22 13,290
Other disposals 79 0 179
As of 31 July 2010 0 0 0
Net carrying amount 31 July 2009 11,040 391 85,066
Net carrying amount 31 July 2010 0 0 22,707