Porsche 2009 Annual Report Download - page 151
Download and view the complete annual report
Please find page 151 of the 2009 Porsche annual report below. You can navigate through the pages in the report by either clicking on the pages listed below, or by using the keyword search tool below to find specific information within the annual report.-
 1
1 -
2
-
3
-
4
-
5
-
6
-
7
-
8
-
9
-
10
-
11
-
12
-
13
-
14
-
15
-
16
-
17
-
18
-
19
-
20
-
21
-
22
-
23
-
24
-
25
-
26
-
27
-
28
-
29
-
30
-
31
-
32
-
33
-
34
-
35
-
36
-
37
-
38
-
39
-
40
-
41
-
42
-
43
-
44
-
45
-
46
-
47
-
48
-
49
-
50
-
51
-
52
-
53
-
54
-
55
-
56
-
57
-
58
-
59
-
60
-
61
-
62
-
63
-
64
-
65
-
66
-
67
-
68
-
69
-
70
-
71
-
72
-
73
-
74
-
75
-
76
-
77
-
78
-
79
-
80
-
81
-
82
-
83
-
84
-
85
-
86
-
87
-
88
-
89
-
90
-
91
-
92
-
93
-
94
-
95
-
96
-
97
-
98
-
99
-
100
-
101
-
102
-
103
-
104
-
105
-
106
-
107
-
108
-
109
-
110
-
111
-
112
-
113
-
114
-
115
-
116
-
117
-
118
-
119
-
120
-
121
-
122
-
123
-
124
-
125
-
126
-
127
-
128
-
129
-
130
-
131
-
132
-
133
-
134
-
135
-
136
-
137
-
138
-
139
-
140
-
 141
141 -
 142
142 -
 143
143 -
 144
144 -
 145
145 -
 146
146 -
 147
147 -
 148
148 -
 149
149 -
 150
150 -
 151
151 -
 152
152 -
 153
153 -
 154
154 -
 155
155 -
 156
156 -
 157
157 -
 158
158 -
 159
159 -
 160
160 -
 161
161 -
162
-
163
-
164
-
165
-
166
-
167
-
168
-
169
-
170
-
171
-
172
-
173
-
174
-
175
-
176
-
177
-
178
-
179
-
180
-
181
-
182
-
183
-
184
-
185
-
186
-
187
-
188
-
189
-
190
-
191
-
192
-
193
-
194
-
195
-
196
-
197
-
198
-
199
-
200
-
201
-
202
-
203
-
204
-
205
-
206
-
207
-
208
-
209
-
210
-
211
-
212
-
213
-
214
-
215
-
216
-
217
-
218
-
219
-
220
-
221
-
222
-
223
-
224
-
225
-
226
-
227
-
228
-
229
-
230
-
231
-
232
-
233
-
234
-
235
-
236
-
237
-
238
-
239
-
240
-
241
-
242
-
243
-
244
-
245
-
246
-
247
-
248
-
249
-
250
-
251
-
252
-
253
-
254
-
255
-
256
-
257
-
258
-
259
-
260
-
261
-
262
-
263
-
264
-
265
-
266
-
267
-
268
-
269
-
270
-
271
-
272
-
273
-
274
-
275
 |
 |

151
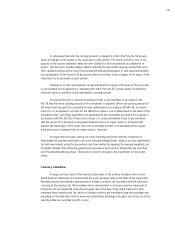
Development costs are recognized for products provided that expenditures can be meas-
ured reliably and all other recognition criteria of IAS 38 are met. The capitalized development costs
include all costs and overhead expenditure directly attributable to the development process incurred
after the point in time at which all recognition criteria are met. Capitalized development costs are
amortized beginning at the start of production using the straight-line method over the expected
useful life of the product, taking any impairments into account. The useful life is usually five to ten
years. Research and non-capitalizable development costs are expensed as incurred.
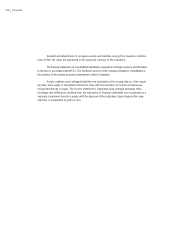
Property, plant and equipment
Items of property, plant and equipment are measured at cost less accumulated deprecia-
tion over the useful life of the assets and any accumulated impairment losses. The cost of items of
property, plant and equipment acquired as part of a business combination is fair value as at the
date of acquisition. Self-constructed items of property, plant and equipment are recognized at cost.
Cost is determined on the basis of the direct and the proportionate indirect production-related costs.
Grants are generally deducted from cost. Costs for repairs and maintenance are recognized as an
expense.
Depreciation, which is generally charged on a straight-line basis, reflects the pattern of the
assets’ expected utility to the company. In some cases higher depreciation rates are applied for
equipment used in shift operations.
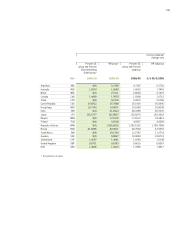
Depreciation is based on the following useful lives:
Years
Buildings 25 to 50
Site improvements 9 to 20
Technical equipment and machinery 6 to 20
Other equipment, furniture and fixtures
(including special tools)
3 to 15
Residual values, depreciation methods and useful lives are reviewed, and adjusted if appro-
priate, at each reporting date.