Nordstrom 2004 Annual Report Download - page 22
Download and view the complete annual report
Please find page 22 of the 2004 Nordstrom annual report below. You can navigate through the pages in the report by either clicking on the pages listed below, or by using the keyword search tool below to find specific information within the annual report.-
 1
1 -
2
-
3
-
4
-
5
-
6
-
7
-
8
-
9
-
10
-
11
-
 12
12 -
 13
13 -
 14
14 -
 15
15 -
 16
16 -
 17
17 -
 18
18 -
 19
19 -
 20
20 -
 21
21 -
 22
22 -
 23
23 -
 24
24 -
 25
25 -
 26
26 -
 27
27 -
 28
28 -
 29
29 -
 30
30
 |
 |

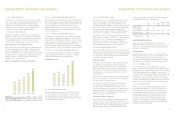
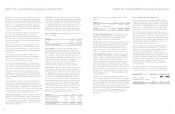
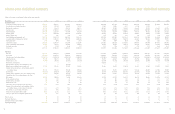
the assumptions used below are different in 2004, the impact of the
assumption change was not significant and does not reflect a change
in the underlying quality of the portfolio.
January 29, January 31,
2005 2004
Total face value of co-branded Nordstrom
VISA credit card principal receivables $612,549 $465,198
Securities issued by the VISA Trust:
Off-balance sheet (sold to third parties):
2002 Class A & B Notes at par value $200,000 $200,000
Amounts recorded on balance sheet:
Investment in asset backed
securities at fair value 422,416 272,294
Expected assumptions used to estimate the fair
value of the investment in asset backed securities:
Weighted average remaining life (in months) 8.1 2.5
Average credit losses 6.9% 5.5%
Average gross yield 15.8% 17.8%
Weighted average coupon on issued securities 3.8% 1.4%
Average payment rates 7.5% 23.4%
Internal rate of returns on
investment in asset backed securities 9.4-16.5% 6.8-12.6%
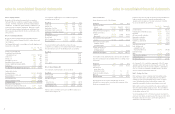
The internal rate of returns represents the volatility and risk of the
assets and is calculated using an established formula that considers
both the current interest rate environment and credit spreads.
The following table illustrates the changes in the fair market value
estimates of the investment in asset backed securities given
independent changes in assumptions as of January 29, 2005:
+10% +20% -10% -20%
Gross yield $5,394 $10,787 $(5,394) $(10,787)
Interest expense on issued
classes (1,038) (2,076) 1,038 2,076
Card holders payment rate 91 98 (214) (606)
Charge offs (2,463) (4,898) 2,492 5,014
Internal rate of return (1,003) (1,990) 1,019 2,054
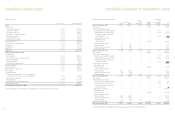
notes to consolidated financial statements
Fiscal Year 2004 2003 2002
Net earnings $393,450 $242,841 $90,224
Basic shares 139,497 136,329 135,107
Dilutive effect of
stock options and
performance share units 2,770 1,410 617
Diluted shares 142,267 137,739 135,724
Basic earnings per share $2.82 $1.78 $0.67
Diluted earnings per share $2.77 $1.76 $0.66
Note 8: Accounts Receivable
The components of accounts receivable are as follows:
January 29, January 31,
2005 2004
Trade receivables:
Unrestricted $31,400 $25,228
Restricted 568,062 589,992
Allowance for doubtful accounts (19,065) (20,320)
Trade receivables, net 580,397 594,900
Other 65,266 71,911
Accounts receivable, net $645,663 $666,811
Our restricted trade receivables relate to our Nordstrom private label
card and back the previously discussed $300,000 Class A notes and the
$150,000 variable funding note renewed in May 2004. The unrestricted
trade receivables consist primarily of our Façonnable trade receivables
and Nordstrom private label receivables that are not eligible for
securitization, such as foreign and employee receivables exceeding
a contractual threshold.
Other accounts receivable consist primarily of credit card receivables
due from third-party financial institutions and vendor rebates, which
are believed to be fully realizable as they are collected soon after they
are earned.
Note 9: Investment in Asset Backed Securities – Co-branded
Nordstrom VISA Credit Card Receivables
The table below summarizes our co-branded Nordstrom VISA credit card
activities and the estimated fair values of our investment in asset
backed securities as well as the assumptions used.
In 2004, we revised the repayment period assumption in our valuation
model that we use to determine the fair value of the VISA Trust. The
2004 repayment period assumption is based on historical payment,
default and finance charge yield experience on a specific account
basis. The prior repayment period assumption was based on our
ongoing payment experience, which included payments by card
holders who pay their account balance in full each month. While
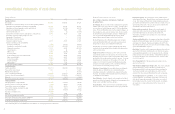
notes to consolidated financial statements
These sensitivities are hypothetical and should be used with caution.
The effect of an adverse change in a particular assumption on the
fair value of the investment in asset backed securities is calculated
without changing any other assumption. In reality, changes in one
factor may result in changes in another, which might alter the
reported sensitivities.
The following table summarizes certain income, expenses and cash
flows received from and paid to the VISA Trust:
Fiscal Year 2004 2003 2002
Principal collections reinvested in
new receivables $2,019,162 $1,332,790 $824,715
Gains on sales of receivables 8,876 4,920 8,290
Income earned on retained interests 46,645 31,926 10,786
Cash flows from retained assets:
Investment in asset
backed securities 76,381 58,222 28,100
Servicing fees 10,698 7,631 5,407
Gross credit losses were $25,182, $22,393, and $18,580 for 2004, 2003
and 2002, and receivables past due for more than 30 days were $9,736
and $8,805 at the end of 2004 and 2003.
The following table illustrates default projections using net credit losses
as a percentage of average outstanding receivables in comparison to
actual performance:
Fiscal Year 2005 2004 2003
Original projection 4.43% 5.59% 6.16%
Actual N/A 4.62% 5.57%
Our continued involvement in the securitization of co-branded
Nordstrom VISA credit card receivables will include recording
gains/losses on sales, recognizing income on investment in asset
backed securities, holding subordinated, non-subordinated and residual
interests in the trust, and servicing the portfolio.
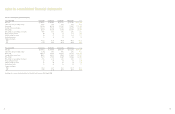
Note 10: Land, Buildings and Equipment
Land, buildings and equipment consist of the following:
January 29, January 31,
2005 2004
Land and land improvements $64,037 $64,238
Buildings and improvements 818,733 838,521
Leasehold improvements 1,066,383 1,011,989
Store fixtures and equipment 1,817,294 1,728,421
Software 233,223 206,751
Construction in progress 91,303 79,016
4,090,973 3,928,936
Less accumulated depreciation
and amortization (2,310,607) (2,121,158)
Land, buildings and equipment, net $1,780,366 $1,807,778
The total cost of buildings and equipment held under capital lease
obligations was $20,035 at the end of 2004 and 2003, with related
accumulated amortization of $15,259 and $14,021. The amortization
of capitalized leased buildings and equipment was recorded in
depreciation expense.
In 2002, we sold the Credit Operation’s office complex and subsequently
leased it back. We received net proceeds of $20,000, and the related
gain of $16,022 is being recognized as a reduction to rent expense
evenly over the 15 year life of the lease.
At January 29, 2005, we have contractual commitments of
approximately $171,000 primarily for the construction of new stores
and the remodeling of existing stores.
Note 11: Long-Term Debt
A summary of long-term debt is as follows:
January 29, January 31,
2005 2004
Private Label Securitization, 4.82%,due 2006 $300,000 $300,000
Senior debentures, 6.95%, due 2028 300,000 300,000
Senior notes, 5.625%, due 2009 250,000 250,000
Senior notes, 8.95%, due 2005 — 196,770
Notes payable, 6.7%, due 2005 96,027 97,500
Mortgage payable, 7.68%, due 2020 75,406 79,204
Other 16,495 18,860
Fair market value of interest rate swap (7,821) (8,091)
Total long-term debt 1,030,107 1,234,243
Less current portion (101,097) (6,833)
Total due beyond one year $929,010 $ 1,227,410
41
40