Nordstrom 2004 Annual Report Download - page 12
Download and view the complete annual report
Please find page 12 of the 2004 Nordstrom annual report below. You can navigate through the pages in the report by either clicking on the pages listed below, or by using the keyword search tool below to find specific information within the annual report.-
 1
1 -
 2
2 -
 3
3 -
 4
4 -
 5
5 -
 6
6 -
 7
7 -
 8
8 -
 9
9 -
 10
10 -
 11
11 -
 12
12 -
 13
13 -
 14
14 -
 15
15 -
 16
16 -
 17
17 -
 18
18 -
 19
19 -
 20
20 -
 21
21 -
 22
22 -
23
-
24
-
25
-
26
-
27
-
28
-
29
-
30
 |
 |

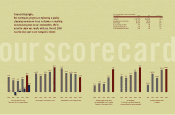
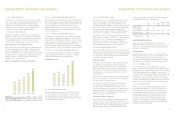
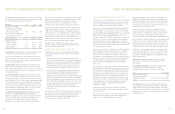
2004 VS 2003 OTHER INCOME INCLUDING FINANCE CHARGES, NET
Our overall other income including finance charges, net increased $17.9
million, primarily from our co-branded VISA credit card program growth.
Since 2002, we marketed this credit card to our in-store customers and
the inactive Nordstrom private label credit card holders. These
marketing efforts showed success in 2004, as the co-branded VISA
credit card holders used the cards more extensively in 2004, resulting
in a 45.7% volume increase.
2003 VS 2002 OTHER INCOME INCLUDING FINANCE CHARGES, NET
We continued to see improvements in our 2003 other income including
finance charges, net primarily due to growth in the co-branded VISA
program. Our income benefited from substantial increases in our VISA
credit card volume and receivables during the year, as well as a small
improvement in the cost of funds and bad debt write-offs. This
increase was partially offset by a decline in finance charge and late fee
income resulting from a decline in our private label accounts receivable.
2005 FORECAST OF OTHER INCOME INCLUDING FINANCE CHARGES, NET
In 2005, other income including finance charges, net is expected to
increase approximately $12 million as we continue to see growth in
our VISA credit card volume and corresponding income.
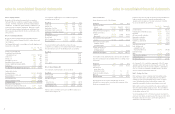
Diluted Earnings per Share
2004 VS 2003 DILUTED EARNINGS PER SHARE
In 2004, earnings per share increased to $2.77 from $1.76 in 2003.
This increase was driven by a strong increase in overall and same-
store sales, improvements in gross profit through better inventory
management, and sales leverage on buying and occupancy and selling,
general and administrative expenses.
management’s discussion and analysis
2003 VS 2002 INTEREST EXPENSE, NET
Interest expense, net increased in 2003 because of debt prepayment
costs of $14.3 million in 2003 and lower capitalized interest. The debt
prepayment costs were partially offset by lower interest expense
resulting from the reduced debt balance outstanding. Capitalized
interest decreased as the completion of several software projects
in early 2003 reduced our software development balance.
2005 FORECAST OF INTEREST EXPENSE, NET
Interest expense for 2005 is expected to decrease as we re-pay the
remaining $96.0 million of our 6.7% medium-term notes due in July
2005. We expect to see a year-over-year reduction in interest expense
of approximately $26 million. A portion of the forecasted interest
expense is based on variable interest rates, which could fluctuate.
Minority Interest Purchase and Reintegration Costs
During 2002, we purchased the outstanding shares of Nordstrom.com,
Inc. series C preferred stock for $70.0 million. The minority interest
purchase and reintegration costs resulted in a one-time charge of
$53.2 million. No tax benefit was recognized as there was no possibility
of a future tax benefit. The impact of not recognizing this income tax
benefit increased our 2002 effective tax rate to 47% before the
cumulative effect of accounting change.
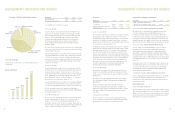
Other Income Including Finance Charges, Net (in millions)
Fiscal Year 2002 2003 2004
Other income including finance charges,
net as a percentage of sales 2.4% 2.4% 2.4%
management’s discussion and analysis
2003 VS 2002 DILUTED EARNINGS PER SHARE
Our earnings per share in 2002 included the write down of a supply
chain software application, the Nordstrom.com minority interest
purchase and reintegration costs and the cumulative effect of an
accounting change associated with the adoption of FAS 142, for a total
impact of $71.0 million or $0.53 per share. We believe that excluding
these charges provides a more comparable basis from which to
evaluate performance between 2003 and 2002. Without the impact
of these charges, 2002 earnings per share would have been $1.19.
Our earnings per share in 2003 increased to $1.76 from $0.66 in 2002.
Excluding the prior year charges noted above, 2003 earnings per share
increased $0.57 or 47.9%. This increase was primarily driven by
a strong increase in overall and same-store sales, significant
improvement in gross profit rate and a moderate decrease in selling,
general and administrative expenses as a percentage of sales.
2005 FORECAST OF DILUTED EARNINGS PER SHARE
Based upon the factors discussed above, especially the expected 2005
same-store sales increase and the 2004 debt prepayment cost that will
not recur in 2005, our diluted earnings per share is expected to increase
16% - 20% in 2005. As we saw in 2004, earnings trends should be
consistent with same-store sales trends.
Fourth Quarter Results
Fourth quarter 2004 net earnings was $140.0 million compared with
$104.3 million in 2003. Fourth quarter 2004 net earnings was
reduced $4.7 million or $0.03 per share due to a non-cash expense
adjustment related to a correction in our lease accounting policy.
Our new policy is to record lease expense when we take possession
of a location; in the past, lease expense started when our retail
operations started.
Total sales for the quarter increased by 9.4% to $2.1 billion and same-
store sales increased by 7.2%. This was the first time in our history
that sales exceeded $2.0 billion in a quarter.
Gross profit as a percentage of net sales increased to 36.6% from
36.2% last year. The quarterly improvement in gross profit as a
percentage of net sales was primarily the result of sales growth
leverage on our buying and occupancy expenses. Selling, general and
administrative expense as a percentage of sales improved 160 basis
points from 28.5% to 26.9%, primarily from lower year-over-year
incentive compensation costs in the quarter.
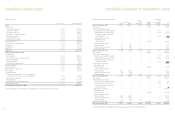
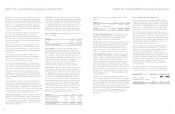
GAAP Sales Reconciliation (in millions)
We converted to a 4-5-4 Retail Calendar at the beginning of 2003 so
our financial results are more comparable to other retailers. Sales
performance numbers included in this document have been calculated
on a comparative 4-5-4 basis. We believe that adjusting for the
difference in days provides a more comparable basis from which to
evaluate sales performance. The following reconciliation bridges the
reported GAAP sales to the 4-5-4 comparable sales.
%Change %Change
YTD YTD Dollar Total Comp
Sales Reconciliation 2003 2004 Increase Sales Sales
Number of Days
Reported GAAP 365 364
Reported GAAP Sales $6,448.7 $7,131.4 $682.7 10.6% N/A
Less Feb. 1, 2003 (18.2) —
Reported 4-5-4 Sales $6,430.5 $7,131.4 $700.9 10.9% 8.5%
4-5-4 Adjusted Days 364 364
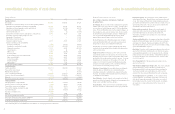
LIQUIDITY AND CAPITAL RESOURCES
Overall, cash and short-term investments decreased by $113.8
million to $402.4 million at the end of 2004, as we used our cash from
operations for capital expenditures, additional debt prepayments and
repurchases of common stock.
Operating Activities
Our operations are seasonal in nature. The second quarter, which
includes our Anniversary Sale, accounts for approximately 27% of net
sales, while the fourth quarter, which includes the holiday season,
accounts for about 29% of net sales. Cash requirements are highest
in the third quarter as we build our inventory for the holiday season.
2004 VS 2003 OPERATING ACTIVITIES
In 2004, cash flow from operating activities increased to $606.3
million, a $7.1 million increase. Higher net earnings was offset by our
merchandise purchase and payment flow changes in 2004 as compared
to 2003 and the timing of income tax payments. Toward the end of
2003 and into 2004, we have achieved a more even flow of merchandise
purchases in relation to our sales trends. Our 2004 inventory turns
have improved over the prior year; the payables leverage we achieved
in 2004 is consistent with our merchandise purchase plan. Income tax
payments have increased in 2004 as a result of our earnings growth.
2003 VS 2002 OPERATING ACTIVITIES
The increase in net cash provided by operating activities between
2003 and 2002 was primarily due to an increase in net earnings
before noncash items, decreases in inventories and increases in
accounts payable, partially offset by an increase in our investment
in asset backed securities. Strong sales and effective inventory
management left us with lower, appropriate inventory levels after
the holidays. January receipts of new merchandise replenished
our inventory levels resulting in an increase in accounts payable.
Investment in asset backed securities increased as Nordstrom VISA
credit sales increased during the year.
21
20
2000 2001 2002 2003 2004
$131
$134
$139
$155
$173
2000 2001 2002 2003 2004
$0.78
$0.93
$0.66
$1.76
$2.77