Nordstrom 2004 Annual Report Download - page 13
Download and view the complete annual report
Please find page 13 of the 2004 Nordstrom annual report below. You can navigate through the pages in the report by either clicking on the pages listed below, or by using the keyword search tool below to find specific information within the annual report.-
 1
1 -
2
-
 3
3 -
 4
4 -
 5
5 -
 6
6 -
 7
7 -
 8
8 -
 9
9 -
 10
10 -
 11
11 -
 12
12 -
 13
13 -
 14
14 -
 15
15 -
 16
16 -
 17
17 -
 18
18 -
 19
19 -
 20
20 -
 21
21 -
 22
22 -
 23
23 -
24
-
25
-
26
-
27
-
28
-
29
-
30
 |
 |

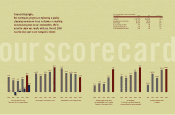
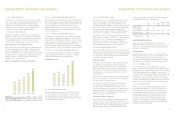
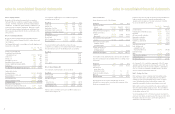
Total Square Footage (in thousands)
Financing Activities
Financing activities primarily consist of principal payments on debt,
dividend payments, repurchases of common stock and proceeds from
the exercise of stock options.
During 2004, we retired $196.8 million of our 8.95% senior notes
and $1.5 million of our 6.7% medium-term notes for a total cash
payment of $220.1 million. After considering non-cash items related
to these debt retirements, our pre-tax expense for debt buyback was
$20.9 million.
During 2003, we purchased $103.2 million of our 8.95% senior notes
and $2.5 million of our 6.7% medium-term notes for a total cash
payment of $120.8 million. Approximately $14.3 million of expense
was recognized during 2003 related to these purchases.
In July 2005, we plan to re-pay the remaining $96.0 million of our 6.7%
medium-term notes at maturity. No additional debt repurchases are
planned for 2005.
In August 2004, our Board of Directors authorized $300.0 million of
share repurchases, replacing a previous share repurchase authorization.
We purchased 6.9 million shares in the open market for the entire
authorized amount of $300.0 million at an average price of $43.43
per share.
In February 2005, our Board of Directors authorized $500.0 million
of additional share repurchases. The actual number and timing of
share repurchases will be subject to market conditions and applicable
SEC rules.
Debt to Capital Ratio
Our recent strong operating results allowed us to repay debt, which
contributed to a decrease in our debt to capital ratio from 43.0% at
management’s discussion and analysis
2005 FORECAST FOR OPERATING ACTIVITIES
In 2005, cash flows provided by operating activities are expected to
increase slightly as a result of increased earnings.
Investing Activities
In 2004, investing activities have primarily consisted of capital
expenditures and the sales and purchases of high quality short-term
investments. Capital expenditures in 2004 decreased slightly in
comparison to 2003 as a planned reduction in store openings reduced
our capital expenditures.
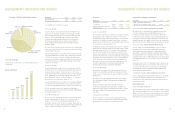
In 2004, 37% of our capital expenditures was for remodels and 28%
was for new stores, half of which related to stores that opened in 2004
and the other half for stores opening in 2005. In addition, 22% of
our capital expenditures was for information technology and 13%
for other routine projects.
Our capital expenditures over the last three years totaled $833.3
million; we received property incentives of $151.1 million over that
same period, which offsets a portion of the cash we used for capital
expenditures. The capital expenditures added stores, enhanced existing
facilities and improved our information systems. More than 2.3 million
square feet of retail store space has been added during this period,
representing an increase of 14% since January 31, 2002.
We plan to spend approximately $850-$875 million, net of property
incentives of approximately $130 million, on capital projects during
the next three years. We plan to use approximately 40% of this capital
to build new stores, 30% on remodels, and 15% toward information
technology. The remaining 15% is planned for other routine projects.
Compared to the previous three years, this represents a 30% increase
in capital expenditures, with more spending allocated to improving our
existing facilities and less spending on information systems. We watch
over our store locations so they meet our customer expectations for a
high-quality shopping experience. We also analyze the useful lives
assigned to our stores so we can match our depreciation with the actual
use of these assets. In the information systems area, we completed
the implementation of our “Point of Sale” system in 2004 and plan
to continue to make investments to enhance our technology platform.
As of January 29, 2005, approximately $171.0 million has been
contractually committed primarily for constructing new stores
or remodeling existing stores.
Consistent with our investment policy, we utilize our high quality short-
term investments to generate income on our available working capital.
management’s discussion and analysis
the end of 2003 to 36.5% at the end of 2004. Other factors that
impacted this ratio in 2004 were the share repurchase described
above and the volume of stock option activity. We believe that a debt
to capital ratio in the range of 25% to 40% results in favorable debt
ratings and sets us on a capital structure that provides appropriate
flexibility while we maintain a reasonable cost of capital.
Off-Balance Sheet Financing
We transfer our Nordstrom co-branded VISA credit card receivables
to a third-party trust that issued $200 million of VISA receivable backed
securities to third parties in 2002. The outstanding balance of the
co-branded VISA credit card receivables exceeds the receivable backed
securities balance. As a result, we hold securities that represent our
retained interests in the trust, recorded as investment in asset backed
securities in our consolidated balance sheets. We do not record the
$200.0 million of VISA receivable backed securities or the co-branded
Nordstrom VISA credit card receivables transferred to the trust on our
consolidated balance sheets.
This off-balance sheet financing allows us greater financial flexibility.
Additionally, our exposure to credit losses on the underlying co-branded
Nordstrom VISA credit card receivables is limited to our investment in
asset backed securities.
Interest Rate Swaps
To manage our interest rate risk, we entered into an interest rate swap
agreement in 2003, which had a $250.0 million notional amount
expiring in 2009. Under the agreement, we receive a fixed rate of
5.63% and pay a variable rate based on LIBOR plus a margin of 2.3%
set at six-month intervals (5.20% at January 29, 2005, based on the
January 18, 2005 LIBOR rate); this reduced our net interest expense in
2004. The interest rate swap agreement had a fair value of ($7.8)
million and ($8.1) million at January 29, 2005 and January 31, 2004.
We have locked in our LIBOR rate until July 15, 2005.
Available Credit
In May 2004, we replaced our existing $300.0 million unsecured line of
credit with a $350.0 million unsecured line of credit, which is available
as liquidity support for our commercial paper program. Under the terms
of the agreement, we pay a variable rate of interest based on LIBOR
plus a margin of 0.31% (2.90% at January 29, 2005). The variable rate
of interest increases to LIBOR plus a margin of 0.41% if more than
$175.0 million is outstanding on the facility. The line of credit
agreement expires in May 2007 and contains restrictive covenants,
which include maintaining a leverage ratio. We also pay a commitment
fee for the line based on our debt rating.
Also in May 2004, we renewed our variable funding note backed by
Nordstrom private label card receivables, but we reduced the capacity
by $50.0 million to $150.0 million due to better pricing on the
unsecured line of credit. This note is renewed annually and interest
is paid based on the actual cost of commercial paper plus specified
fees. We also pay a commitment fee for the note based on the amount
of the commitment.
We did not make any borrowings under our unsecured line of credit
or our variable funding note backed by Nordstrom private label card
receivables during 2004.
We also have universal shelf registrations on file with the Securities
and Exchange Commission that permit us to offer an additional $450
million of securities to the public. These registration statements allow
us to issue various types of securities, including debt, common stock,
warrants to purchase common stock, warrants to purchase debt
securities and warrants to purchase or sell foreign currency.
Debt Ratings
The following table shows our credit ratings at the date of this report.
Standard
Credit Ratings Moody’s and Poor’s
Senior unsecured debt Baa1 A-
Commercial paper P-2 A-2
Outlook Stable Stable
These ratings could change depending on our performance and other
factors. Our outstanding debt is not subject to termination or interest
rate adjustments based on changes in our credit ratings.
Contractual Obligations (in millions)
The following table summarizes our contractual obligations and the
expected effect on our liquidity and cash flows. We expect to fund
these commitments primarily with operating cash flows generated in
the normal course of business and credit available to us under existing
and potential future facilities.
Less More
than 1-3 3-5 than 5
Fiscal Year Total 1 year years years years
Long-term debt $1,227.5 $100.1 $507.3 $258.0 $362.1
Capital lease
obligations 17.8 2.3 3.9 3.3 8.3
Operating leases 699.8 72.5 138.5 128.5 360.3
Purchase
obligations 1,007.5 932.9 65.2 9.4 —
Other long-term
liabilities 153.2 — 55.4 20.4 77.4
Total $3,105.8 $1,107.8 $770.3 $419.6 $808.1
23
22
2000 2001 2002 2003 2004
16,056
17,048
18,428
19,138 19,397