Nordstrom 2004 Annual Report Download - page 11
Download and view the complete annual report
Please find page 11 of the 2004 Nordstrom annual report below. You can navigate through the pages in the report by either clicking on the pages listed below, or by using the keyword search tool below to find specific information within the annual report.-
 1
1 -
 2
2 -
 3
3 -
 4
4 -
 5
5 -
 6
6 -
 7
7 -
 8
8 -
 9
9 -
 10
10 -
 11
11 -
 12
12 -
 13
13 -
 14
14 -
 15
15 -
 16
16 -
 17
17 -
 18
18 -
 19
19 -
 20
20 -
 21
21 -
 22
22 -
23
-
24
-
25
-
26
-
27
-
28
-
29
-
30
 |
 |

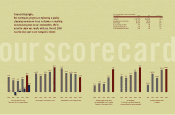
RESULTS OF OPERATIONS
Segment results are discussed in each of the following sections
as applicable.
Net Sales (in millions)
Fiscal Year 2002 2003 2004
Net sales increase 6.0% 8.5% 10.6%
Same-store sales increase 1.4% 4.1% 8.5%
See our GAAP sales reconciliation on page 21.
2004 VS 2003 NET SALES
In general, retailers’ sales results were mixed in 2004. Our net sales
increased as our customers responded to our merchandise offerings.
Both our Full-Line and Rack stores had overall and same-store sales
increases. All of our geographic regions and major merchandise
categories also reported overall and same-store sales increases.
The strongest performing categories were Accessories, Women’s
Shoes and Women’s Better Apparel, followed by Women’s Designer
and Men’s Apparel.
Total net sales also benefited from the six Full-Line stores and two Rack
stores opened since February 2003, increasing our retail square footage
5% during the last two years.
Sales at Nordstrom Direct increased 28.3% due to strong Internet sales
and improved fulfillment of customer orders. Internet sales increased
53.1% due to an increase in the rate of website visits that result in
sales and increased Internet advertising. Catalog net sales decreased
in 2004 by 3%, which is consistent with our strategy to shift catalog
customers to the Internet.
2003 VS 2002 NET SALES
We had significant sales growth in 2003 as net sales increased 8.5%
over the prior year. This overall growth resulted from same-store sales
increases and store openings. Same-store sales on a 4-5-4 basis
increased 4.1% due to increases at both our Full-Line stores and Rack
stores. Additionally, we opened twelve Full-Line and six Rack stores
since February 2002. We also closed one Rack store. The net impact
was an increase to our retail square footage of 12%.
Sales at Nordstrom Direct increased 15.4% due to improved fulfillment
of customers orders and strong Internet sales. During 2003, Internet
sales increased approximately 46% while catalog sales declined by 9%.
In 2003, merchandise division sales growth was led by Women’s
Designer Apparel, Accessories and Cosmetics, followed by Men’s Apparel
and Women’s and Men’s Shoes.
2005 FORECAST OF NET SALES
In 2005, we plan to open four Full-Line stores, increasing retail square
footage by approximately 3%. We expect 2005 same-store sales to
increase 1 to 3%. In 2005, we will expand the integration of our
merchandise offerings across our full-price channels. Our goal for the
next several years is to build a multi-channel merchandise offering that
creates a superior and seamless experience for our customers.
management’s discussion and analysis management’s discussion and analysis
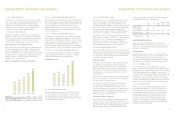
Gross Profit
Fiscal Year 2002 2003 2004
Gross profit as a percentage
of net sales 33.2% 34.6% 36.1%
Average inventory per square foot $58.15 $54.81 $52.46
Inventory turnover 3.85 4.10 4.51
2004 VS 2003 GROSS PROFIT
In 2004, the improvement in gross profit as a percentage of net sales
was primarily a result of meeting our customers’ desire for fresh,
compelling merchandise, which increased the sales of regular priced
merchandise. In addition, gross profit benefited from our ongoing
improvement in managing inventory and by holding buying costs and
the fixed portion of occupancy expenses flat.
Contributing to our gross profit rate improvement was the continuous
improvement we are making utilizing our perpetual inventory system
investment, which we made in 2003. We have better visibility into
sales trends and on-hand content, allowing us to more effectively
manage our merchandise; the result was a significant improvement
in our inventory turnover rate. Increased sell-through of regular priced
merchandise reduced the markdowns necessary to sell slow moving
goods. We maintained our inventory at levels consistent with the
prior year, even though our sales and square footage grew in 2004.
The overall improvements in merchandise management have
generated higher margins on our inventory investments.
2003 VS 2002 GROSS PROFIT
Gross profit as a percentage of net sales improved in 2003 due to
strong sales, substantially lower markdowns and improved shrink
results, as well as an improvement in expenses related to our private
label business.
Merchandise division gross profit was led by Accessories, Women’s
Specialized Apparel, Women’s Contemporary/Juniors Apparel and
Men’s Apparel.
Average inventory per square foot declined due to improved
merchandise management at both our Full-Line and Rack stores.
Buying and occupancy expenses benefited from leverage on a higher
sales base resulting in a small improvement on a percentage of
sales basis.
2005 FORECAST OF GROSS PROFIT
In 2005, we expect to see a 10 to 20 basis point improvement in
our gross profit rate performance from ongoing merchandise margin
improvement as well as buying and occupancy efficiencies.
Selling, General and Administrative Expenses
Fiscal Year 2002 2003 2004
Selling, general and administrative
expenses as a percentage of sales 30.0% 29.4% 28.3%
2004 VS 2003 SELLING, GENERAL AND ADMINISTRATIVE EXPENSES
We continued to use our infrastructure to support increased sales.
In 2004, our selling, general and administrative expenses as a
percentage of net sales improved 110 basis points. We were able
to control and leverage our fixed general and administrative expenses,
especially non-selling labor. While selling expense increased in 2004,
primarily from higher costs linked to increased sales, we experienced a
slight rate improvement in selling expense as a percentage of net sales.
2003 VS 2002 SELLING, GENERAL AND ADMINISTRATIVE EXPENSES
The 2002 selling, general and administrative expense includes an
impairment charge of $15.6 million related to the write-down of
an information technology investment in a supply chain software
application in our private label division. We believe that excluding
this charge provides a more comparable basis from which to evaluate
performance between years. Without this charge, 2002 selling, general
and administrative expenses as a percentage of net sales would have
been 29.7%.
Excluding the effects of the 2002 impairment charge, selling, general
and administrative expenses as a percentage of net sales decreased
in 2003 to 29.4% from 29.7% in the prior year. This improvement
was primarily the result of leverage on better-than-planned sales
and overall expense improvements.
2005 FORECAST OF SELLING, GENERAL AND ADMINISTRATIVE EXPENSES
In 2005, selling, general and administrative expenses as a percentage
of net sales are expected to improve 40 to 60 basis points as we
continue to take steps to improve the effectiveness and efficiency of
our business processes.
Interest Expense, Net
2004 VS 2003 INTEREST EXPENSE, NET
We prepaid debt of $198.2 million in 2004 and $105.7 million in 2003.
We incurred debt prepayment costs of $20.9 million in 2004 and $14.3
million in 2003. The decrease in our interest expense, net in 2004 was
due to the reduction in our 2004 average outstanding debt, partially
offset by the increase in the prepayment costs.
19
18
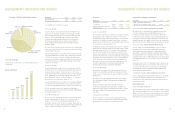
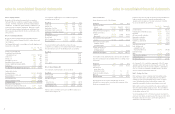
women’s
apparel 36%
women’s accessories
and cosmetics 20%
shoes 20%
men’s
apparel 18%
children’s apparel 3%
other 3%
Percentage of 2004 Sales by Merchandise Category
2000 2001 2002 2003 2004
$5,512
$5,608
$5,945
$6,449
$7,131