Nordstrom 2004 Annual Report Download - page 21
Download and view the complete annual report
Please find page 21 of the 2004 Nordstrom annual report below. You can navigate through the pages in the report by either clicking on the pages listed below, or by using the keyword search tool below to find specific information within the annual report.-
 1
1 -
2
-
3
-
4
-
5
-
6
-
7
-
8
-
9
-
10
-
 11
11 -
 12
12 -
 13
13 -
 14
14 -
 15
15 -
 16
16 -
 17
17 -
 18
18 -
 19
19 -
 20
20 -
 21
21 -
 22
22 -
 23
23 -
 24
24 -
 25
25 -
 26
26 -
 27
27 -
 28
28 -
 29
29 -
 30
30
 |
 |

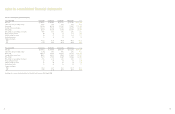
The components of SERP expense and a summary of significant
assumptions are as follows:
Fiscal Year 2004 2003 2002
Service cost $1,489 $819 $1,447
Interest cost 3,965 3,420 3,537
Amortization of net loss 1,543 751 1,613
Amortization of prior service cost 962 693 1,004
Amortization of transition obligation —— 324
Total expense $7,959 $5,683 $7,925
Assumption percentages:
Discount rate 6.25% 6.25% 7.00%
Rate of compensation increase 4.00% 4.00% 4.00%
Measurement date 10/31/04 10/31/03 10/31/02
The expected future benefit payments based upon the same
assumptions as of January 29, 2005 and including benefits attributable
for future employee service for the following periods are as follows:
Fiscal Year
2005 $3,471
2006 3,497
2007 3,591
2008 3,589
2009 3,641
2010 - 2014 22,733
Note 5: Interest Expense, Net
The components of interest expense, net are as follows:
Fiscal Year 2004 2003 2002
Short-term debt $725 $652 $677
Long-term debt 87,793 99,866 89,850
Total interest expense 88,518 100,518 90,527
Less:
Interest income (7,929) (5,981) (4,254)
Capitalized interest (3,161) (3,585) (4,352)
Interest expense, net $77,428 $90,952 $81,921
Interest income is recorded in our Corporate and Other segment as an
offset to interest expense, net.
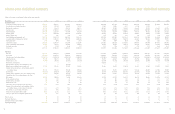
notes to consolidated financial statements
Note 3: Employee Benefits
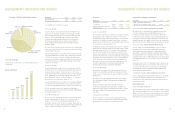
We provide a 401(k) and profit sharing plan for our employees.
The Board of Directors establishes our profit sharing contribution
each year. The 401(k) component is funded by voluntary employee
contributions. In addition, we provide matching contributions up to
a fixed percentage of employee contributions. Our expense related
to the profit sharing component and matching contributions to the
401(k) component totaled $54,186, $51,720, and $33,668 in 2004,
2003, and 2002.
Note 4: Postretirement Benefits
We have an unfunded Supplemental Executive Retirement Plan
(“SERP”), which provides retirement benefits to certain officers and
select employees.
The following table provides a reconciliation of benefit obligations and
funded status of the SERP:
Jan. 29, Jan. 31,
2005 2004
Change in benefit obligation:
Accumulated benefit obligation
at beginning of year $59,613 $47,573
Service cost 1,489 819
Interest cost 3,965 3,420
Amortization of net loss 1,543 751
Amortization of prior service cost 962 693
Change in additional minimum liability (766) 9,046
Distributions (2,856) (2,689)
Accumulated benefit obligation at end of year $63,950 $59,613
Funded status of plan:
Underfunded status $(69,598) $(64,870)
Unrecognized prior service cost 5,266 6,228
Unrecognized loss 24,989 24,403
Accrued pension cost (39,343) (34,239)
Additional minimum liability (24,607) (25,374)
Total SERP liability $(63,950) $(59,613)
Other balance sheet amounts:
Intangible asset included in other assets $5,266 $6,228
Accumulated other comprehensive loss, net of tax 11,798 11,679
notes to consolidated financial statements
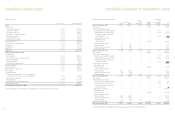
Note 6: Income Taxes
Income tax expense consists of the following:
Fiscal Year 2004 2003 2002
Current income taxes:
Federal $282,430 $118,559 $76,901
State and local 45,091 15,516 10,633
Total current income tax expense 327,521 134,075 87,534
Deferred income taxes:
Current (15,259) (7,904) (4,225)
Non-current (58,431) 29,129 8,732
Total deferred income tax (benefit)
expense (73,690) 21,225 4,507
Total income tax expense before
cumulative effect of
accounting change 253,831 155,300 92,041
Deferred income taxes on
cumulative effect of
accounting change —— (8,541)
Total income tax expense $253,831 $155,300 $83,500
A reconciliation of the statutory Federal income tax rate to the effective
tax rate on earnings before the cumulative effect of accounting change
is as follows:
Fiscal Year 2004 2003 2002
Statutory rate 35.0% 35.0% 35.0%
State and local
income taxes, net of
Federal income taxes 3.5 3.1 3.8
Change in valuation allowance 0.3 — 8.5
Other, net 0.4 0.9 (0.2)
Effective tax rate 39.2% 39.0% 47.1%
Our effective tax rate in 2002 was unusually high, due to non-
deductible losses we incurred in connection with our purchase of the
Nordstrom.com minority interest.
Deferred income taxes reflect the net tax effect of temporary differences
between amounts recorded for financial reporting purposes and
amounts used for tax purposes. The major components of deferred
tax assets and liabilities are as follows:
January 29, January 31,
2005 2004
Accrued expenses $56,135 $41,096
Compensation and benefits accruals 57,947 55,013
Bad debts 6,309 6,799
Gift cards and gift certificates 12,743 2,172
Merchandise certificates 3,461 3,721
Merchandise inventories 20,933 24,630
Capital loss carryforwards 6,286 6,286
Other 1,654 9,722
Total deferred tax assets 165,468 149,439
Land, buildings and
equipment basis and
depreciation differences (13,294) (78,558)
Employee benefits ——
Other (11,317) (5,532)
Total deferred tax liabilities (24,611) (84,090)
Valuation allowance (1,800) —
Net deferred tax assets $139,057 $65,349
As of January 29, 2005, capital loss carryforwards of $16,117 remain
available to offset capital gain income through the end of 2005. We
expect to utilize most, but not all, of this capital loss carryforward in
2005. As a result, we established a valuation allowance in 2004 of
$1,800 to offset the related deferred tax asset.
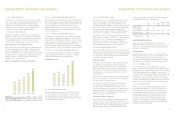
Note 7: Earnings Per Share
Basic earnings per share is computed using the weighted average
number of common shares outstanding during the year. Diluted
earnings per share uses the weighted average number of common
shares outstanding during the year plus dilutive common stock
equivalents, primarily stock options and performance share units.
Options with an exercise price greater than the average market price
were not included in diluted earnings per share. These anti-dilutive
options totaled 5,335 and 7,259 shares in 2003 and 2002. There were
no anti-dilutive options in 2004.
Since the beginning of 2003, 5,878 shares have been issued upon the
exercise of stock options; we repurchased 6,908 shares in 2004 to offset
the impact of these share issuances and to return capital to our
shareholders in an efficient manner.
39
38