Neiman Marcus 2003 Annual Report Download - page 9
Download and view the complete annual report
Please find page 9 of the 2003 Neiman Marcus annual report below. You can navigate through the pages in the report by either clicking on the pages listed below, or by using the keyword search tool below to find specific information within the annual report.-
 1
1 -
 2
2 -
 3
3 -
 4
4 -
 5
5 -
 6
6 -
 7
7 -
 8
8 -
 9
9 -
 10
10 -
 11
11 -
 12
12 -
 13
13 -
 14
14 -
 15
15 -
 16
16 -
 17
17 -
 18
18 -
 19
19 -
 20
20 -
21
-
22
-
23
-
24
-
25
-
26
-
27
-
28
-
29
-
30
-
31
-
32
-
33
-
34
-
35
-
36
-
37
-
38
-
39
-
40
-
41
-
42
-
43
-
44
-
45
-
46
-
47
-
48
-
49
-
50
-
51
-
52
-
53
-
54
-
55
-
56
-
57
-
58
-
59
-
60
-
61
-
62
-
63
-
64
-
65
-
66
-
67
-
68
-
69
-
70
-
71
-
72
-
73
-
74
-
75
-
76
-
77
-
78
-
79
-
80
-
81
-
82
-
83
-
84
-
85
-
86
-
87
-
88
-
89
-
90
-
91
-
92
-
93
-
94
-
95
-
96
-
97
-
98
-
99
-
100
-
101
-
102
-
103
-
104
-
105
-
106
-
107
-
108
-
109
-
110
-
111
-
112
-
113
-
114
-
115
-
116
-
117
-
118
-
119
-
120
-
121
-
122
-
123
-
124
-
125
-
126
-
127
-
128
-
129
-
130
-
131
-
132
-
133
-
134
-
135
-
136
-
137
-
138
-
139
-
140
-
141
-
142
-
143
-
144
-
145
-
146
-
147
-
148
-
149
-
150
-
151
-
152
-
153
-
154
-
155
-
156
-
157
-
158
-
159
-
160
-
161
-
162
-
163
-
164
-
165
-
166
-
167
-
168
-
169
-
170
-
171
-
172
-
173
-
174
-
175
-
176
-
177
-
178
-
179
-
180
-
181
-
182
-
183
-
184
-
185
-
186
-
187
-
188
-
189
-
190
-
191
-
192
-
193
-
194
-
195
-
196
-
197
-
198
-
199
-
200
-
201
-
202
-
203
-
204
-
205
-
206
-
207
-
208
-
209
-
210
-
211
-
212
-
213
-
214
-
215
-
216
-
217
-
218
-
219
-
220
-
221
-
222
-
223
-
224
-
225
-
226
-
227
-
228
-
229
-
230
-
231
-
232
-
233
-
234
-
235
-
236
-
237
-
238
-
239
-
240
-
241
-
242
-
243
-
244
-
245
-
246
-
247
-
248
-
249
-
250
-
251
-
252
-
253
-
254
-
255
-
256
-
257
-
258
-
259
-
260
-
261
-
262
-
263
-
264
-
265
-
266
-
267
-
268
-
269
-
270
-
271
-
272
-
273
-
274
-
275
-
276
-
277
-
278
-
279
-
280
-
281
-
282
-
283
-
284
-
285
-
286
-
287
-
288
-
289
-
290
-
291
-
292
-
293
-
294
-
295
-
296
-
297
-
298
-
299
-
300
-
301
-
302
-
303
-
304
-
305
-
306
-
307
-
308
-
309
-
310
-
311
-
312
-
313
-
314
-
315
-
316
-
317
-
318
-
319
-
320
-
321
-
322
-
323
-
324
-
325
-
326
-
327
-
328
-
329
-
330
-
331
-
332
-
333
-
334
-
335
-
336
-
337
-
338
-
339
-
340
-
341
-
342
-
343
-
344
-
345
-
346
-
347
-
348
-
349
-
350
-
351
-
352
-
353
-
354
-
355
-
356
-
357
 |
 |

In the past three years, the Company has made capital expenditures aggregating $367 million related primarily to:
• the construction of new stores in Orlando, Florida and Coral Gables, Florida;
• the renovation and expansion of its Bergdorf Goodman store in New York City and Neiman Marcus stores in San Francisco,
California; Newport Beach, California; and Las Vegas, Nevada;
• the expansion of its distribution facilities;
• new point-of-sale system in the Company's retail stores; and
• new financial systems and non-merchandise procurement modules of Oracle.
In 2005, the Company anticipates capital expenditures for planned new stores in San Antonio, Texas; Boca Raton, Florida; Austin,
Texas; Charlotte, North Carolina; and Natick, Massachusetts and renovations of the Newport Beach, San Francisco and Houston
stores as well as the main Bergdorf Goodman store. The Company also expects to make technology related expenditures for new
warehousing and distribution systems to support its Direct Marketing operation and a new human capital management system, both of
which are scheduled for implementation in fiscal year 2006.
Competition
The specialty retail industry is highly competitive and fragmented. The Company competes with large specialty retailers, traditional
and upscale department stores, national apparel chains, designer boutiques, individual specialty apparel stores and direct marketing
firms. The Company competes for customers principally on the basis of quality and fashion, customer service, value, assortment and
presentation of merchandise, marketing and customer loyalty programs and, in the case of Neiman Marcus and Bergdorf Goodman,
store ambiance.
Employees
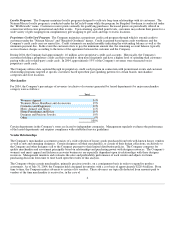
As of September 7, 2004, the Company had approximately 15,700 employees. Neiman Marcus stores had approximately 13,000
employees, Bergdorf Goodman stores had approximately 1,000 employees, Neiman Marcus Direct had approximately 1,600
employees and Neiman Marcus Group had approximately 70 employees. The Company's staffing requirements fluctuate during the
year as a result of the seasonality of the retail industry. The Company hires additional temporary associates and increases the hours of
part-time employees during seasonal peak selling periods. None of the Company's employees are subject to collective bargaining
agreements, except for approximately 15 percent of the Bergdorf Goodman employees. The Company believes that its relations with
its employees are good.
Seasonality
The Company's business, like that of most retailers, is affected by seasonal fluctuations in customer demand, product offerings and
working capital expenditures. For additional information on seasonality, see Item 7, "Management's Discussion and Analysis of
Financial Condition and Results of Operations - Executive Overview – Overview of the Company's Business. "
Regulation
The Company's operations are affected by numerous federal and state laws that impose disclosure and other requirements upon the
origination, servicing and enforcement of credit accounts and limitations on the maximum amount of finance charges that may be
charged by a credit provider. In addition to the Company's proprietary credit cards, credit to the Company's customers is also
provided primarily through third parties such as American Express®, Visa® and MasterCard®. Any change in the regulation of credit
that would materially limit the availability of credit to the Company's customer base could adversely affect the Company's results of
operations or financial condition.
6