Neiman Marcus 2003 Annual Report Download - page 21
Download and view the complete annual report
Please find page 21 of the 2003 Neiman Marcus annual report below. You can navigate through the pages in the report by either clicking on the pages listed below, or by using the keyword search tool below to find specific information within the annual report.-
 1
1 -
2
-
3
-
4
-
5
-
6
-
7
-
8
-
9
-
10
-
 11
11 -
 12
12 -
 13
13 -
 14
14 -
 15
15 -
 16
16 -
 17
17 -
 18
18 -
 19
19 -
 20
20 -
 21
21 -
 22
22 -
 23
23 -
 24
24 -
 25
25 -
 26
26 -
 27
27 -
 28
28 -
 29
29 -
 30
30 -
 31
31 -
32
-
33
-
34
-
35
-
36
-
37
-
38
-
39
-
40
-
41
-
42
-
43
-
44
-
45
-
46
-
47
-
48
-
49
-
50
-
51
-
52
-
53
-
54
-
55
-
56
-
57
-
58
-
59
-
60
-
61
-
62
-
63
-
64
-
65
-
66
-
67
-
68
-
69
-
70
-
71
-
72
-
73
-
74
-
75
-
76
-
77
-
78
-
79
-
80
-
81
-
82
-
83
-
84
-
85
-
86
-
87
-
88
-
89
-
90
-
91
-
92
-
93
-
94
-
95
-
96
-
97
-
98
-
99
-
100
-
101
-
102
-
103
-
104
-
105
-
106
-
107
-
108
-
109
-
110
-
111
-
112
-
113
-
114
-
115
-
116
-
117
-
118
-
119
-
120
-
121
-
122
-
123
-
124
-
125
-
126
-
127
-
128
-
129
-
130
-
131
-
132
-
133
-
134
-
135
-
136
-
137
-
138
-
139
-
140
-
141
-
142
-
143
-
144
-
145
-
146
-
147
-
148
-
149
-
150
-
151
-
152
-
153
-
154
-
155
-
156
-
157
-
158
-
159
-
160
-
161
-
162
-
163
-
164
-
165
-
166
-
167
-
168
-
169
-
170
-
171
-
172
-
173
-
174
-
175
-
176
-
177
-
178
-
179
-
180
-
181
-
182
-
183
-
184
-
185
-
186
-
187
-
188
-
189
-
190
-
191
-
192
-
193
-
194
-
195
-
196
-
197
-
198
-
199
-
200
-
201
-
202
-
203
-
204
-
205
-
206
-
207
-
208
-
209
-
210
-
211
-
212
-
213
-
214
-
215
-
216
-
217
-
218
-
219
-
220
-
221
-
222
-
223
-
224
-
225
-
226
-
227
-
228
-
229
-
230
-
231
-
232
-
233
-
234
-
235
-
236
-
237
-
238
-
239
-
240
-
241
-
242
-
243
-
244
-
245
-
246
-
247
-
248
-
249
-
250
-
251
-
252
-
253
-
254
-
255
-
256
-
257
-
258
-
259
-
260
-
261
-
262
-
263
-
264
-
265
-
266
-
267
-
268
-
269
-
270
-
271
-
272
-
273
-
274
-
275
-
276
-
277
-
278
-
279
-
280
-
281
-
282
-
283
-
284
-
285
-
286
-
287
-
288
-
289
-
290
-
291
-
292
-
293
-
294
-
295
-
296
-
297
-
298
-
299
-
300
-
301
-
302
-
303
-
304
-
305
-
306
-
307
-
308
-
309
-
310
-
311
-
312
-
313
-
314
-
315
-
316
-
317
-
318
-
319
-
320
-
321
-
322
-
323
-
324
-
325
-
326
-
327
-
328
-
329
-
330
-
331
-
332
-
333
-
334
-
335
-
336
-
337
-
338
-
339
-
340
-
341
-
342
-
343
-
344
-
345
-
346
-
347
-
348
-
349
-
350
-
351
-
352
-
353
-
354
-
355
-
356
-
357
 |
 |

Inflation and Deflation
The Company believes changes in revenues and net earnings that have resulted from inflation or deflation have not been material
during the periods presented. The Company attempts to offset the effects of inflation, which has occurred in recent years in SG&A
expenses, through price increases and control of expenses, although the Company's ability to increase prices is limited by competitive
factors in its markets. The Company attempts to offset the effects of merchandise deflation, which has occurred on a limited basis in
recent years, through control of expenses. There is no assurance, however, that inflation or deflation will not materially affect the
Company in the future.
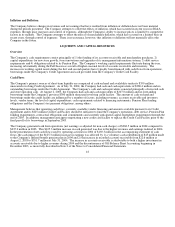
LIQUIDITY AND CAPITAL RESOURCES
Overview
The Company's cash requirements consist principally of 1) the funding of its accounts receivable and merchandise purchases, 2)
capital expenditures for new store growth, store renovations and upgrades of its management information systems, 3) debt service
requirements and 4) obligations related to its Pension Plan. The Company's working capital requirements fluctuate during the year,
increasing substantially during the Fall Season as a result of higher seasonal levels of accounts receivable and inventory. The
increases in working capital needs during the first and second quarters have typically been financed with cash flows from operations,
borrowings under the Company's Credit Agreement and cash provided from the Company's Credit Card Facility.
Cash Flows
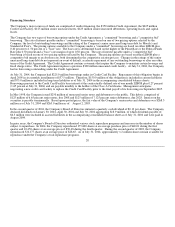
The Company's primary sources of short-term liquidity are comprised of cash on hand and availability under its $350 million
unsecured revolving Credit Agreement. As of July 31, 2004, the Company had cash and cash equivalents of $368.4 million and no
outstanding borrowings under the Credit Agreement. The Company's cash and cash equivalents consisted principally of invested cash
and store operating cash. At August 2, 2003, the Company had cash and cash equivalents of $207.0 million and no outstanding
borrowings under the Company's previous $300 million unsecured revolving credit facility. The amount of cash on hand and
borrowings under the credit facility are influenced by a number of factors, including revenues, accounts receivable and inventory
levels, vendor terms, the level of capital expenditures, cash requirements related to financing instruments, Pension Plan funding
obligations and the Company's tax payment obligations, among others.
Management believes that operating cash flows, currently available vendor financing and amounts available pursuant to its Credit
Agreement and its $225 million Credit Card Facility should be sufficient to fund the Company's operations, debt service, Pension Plan
funding requirements, contractual obligations and commitments and currently anticipated capital expenditure requirements through the
end of 2005. In addition, management anticipates negotiating a new credit card facility to replace the Credit Card Facility prior to the
final payoff of its borrowings in September 2005.
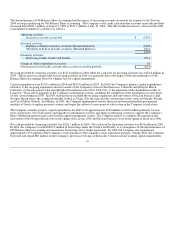
The Company generated cash from operations (net earnings as adjusted for non-cash charges) of $362.5 million in 2004 compared to
$237.2 million in 2003. This $125.3 million increase in cash generated was due to the higher revenues and earnings realized in 2004.
In the presentation of net cash flows used by operating activities in 2004 of $192.3 million in the accompanying statement of cash
flows, the cash impact of the $125.3 million increase in earnings was affected by 1) a voluntary cash contribution of $45 million made
to the Company's defined benefit pension plan in 2004 and 2) the increase in recorded accounts receivable from $22.6 million at
August 2, 2003 to $551.7 million at July 31, 2004. The increase in accounts receivable is attributable to both a higher investment in
accounts receivable due to higher revenues during 2004 and the discontinuance of Off-Balance Sheet Accounting beginning in
December 2003, as more fully described in Note 2 of the Notes to Consolidated Financial Statements.
18