Neiman Marcus 2003 Annual Report Download - page 63
Download and view the complete annual report
Please find page 63 of the 2003 Neiman Marcus annual report below. You can navigate through the pages in the report by either clicking on the pages listed below, or by using the keyword search tool below to find specific information within the annual report.-
 1
1 -
2
-
3
-
4
-
5
-
6
-
7
-
8
-
9
-
10
-
11
-
12
-
13
-
14
-
15
-
16
-
17
-
18
-
19
-
20
-
21
-
22
-
23
-
24
-
25
-
26
-
27
-
28
-
29
-
30
-
31
-
32
-
33
-
34
-
35
-
36
-
37
-
38
-
39
-
40
-
41
-
42
-
43
-
44
-
45
-
46
-
47
-
48
-
49
-
50
-
51
-
52
-
 53
53 -
 54
54 -
 55
55 -
 56
56 -
 57
57 -
 58
58 -
 59
59 -
 60
60 -
 61
61 -
 62
62 -
 63
63 -
 64
64 -
 65
65 -
 66
66 -
 67
67 -
 68
68 -
 69
69 -
 70
70 -
 71
71 -
 72
72 -
 73
73 -
74
-
75
-
76
-
77
-
78
-
79
-
80
-
81
-
82
-
83
-
84
-
85
-
86
-
87
-
88
-
89
-
90
-
91
-
92
-
93
-
94
-
95
-
96
-
97
-
98
-
99
-
100
-
101
-
102
-
103
-
104
-
105
-
106
-
107
-
108
-
109
-
110
-
111
-
112
-
113
-
114
-
115
-
116
-
117
-
118
-
119
-
120
-
121
-
122
-
123
-
124
-
125
-
126
-
127
-
128
-
129
-
130
-
131
-
132
-
133
-
134
-
135
-
136
-
137
-
138
-
139
-
140
-
141
-
142
-
143
-
144
-
145
-
146
-
147
-
148
-
149
-
150
-
151
-
152
-
153
-
154
-
155
-
156
-
157
-
158
-
159
-
160
-
161
-
162
-
163
-
164
-
165
-
166
-
167
-
168
-
169
-
170
-
171
-
172
-
173
-
174
-
175
-
176
-
177
-
178
-
179
-
180
-
181
-
182
-
183
-
184
-
185
-
186
-
187
-
188
-
189
-
190
-
191
-
192
-
193
-
194
-
195
-
196
-
197
-
198
-
199
-
200
-
201
-
202
-
203
-
204
-
205
-
206
-
207
-
208
-
209
-
210
-
211
-
212
-
213
-
214
-
215
-
216
-
217
-
218
-
219
-
220
-
221
-
222
-
223
-
224
-
225
-
226
-
227
-
228
-
229
-
230
-
231
-
232
-
233
-
234
-
235
-
236
-
237
-
238
-
239
-
240
-
241
-
242
-
243
-
244
-
245
-
246
-
247
-
248
-
249
-
250
-
251
-
252
-
253
-
254
-
255
-
256
-
257
-
258
-
259
-
260
-
261
-
262
-
263
-
264
-
265
-
266
-
267
-
268
-
269
-
270
-
271
-
272
-
273
-
274
-
275
-
276
-
277
-
278
-
279
-
280
-
281
-
282
-
283
-
284
-
285
-
286
-
287
-
288
-
289
-
290
-
291
-
292
-
293
-
294
-
295
-
296
-
297
-
298
-
299
-
300
-
301
-
302
-
303
-
304
-
305
-
306
-
307
-
308
-
309
-
310
-
311
-
312
-
313
-
314
-
315
-
316
-
317
-
318
-
319
-
320
-
321
-
322
-
323
-
324
-
325
-
326
-
327
-
328
-
329
-
330
-
331
-
332
-
333
-
334
-
335
-
336
-
337
-
338
-
339
-
340
-
341
-
342
-
343
-
344
-
345
-
346
-
347
-
348
-
349
-
350
-
351
-
352
-
353
-
354
-
355
-
356
-
357
 |
 |

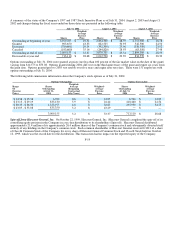
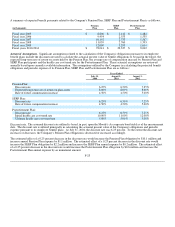
Expected long-term rate of return on plan assets. The assumed expected long-term rate of return on assets is the weighted average
rate of earnings expected on the funds invested or to be invested to provide for the pension obligation. During 2004, the Company
utilized 8.0 percent as the expected long-term rate of return on plan assets. The Company periodically evaluates the allocation
between investment categories of the assets held by the Pension Plan. The expected average long-term rate of return on assets is based
principally on the counsel of the Company's outside actuaries and advisors. This rate is utilized primarily in calculating the expected
return on plan assets component of the annual pension expense. To the extent the actual rate of return on assets realized over the
course of a year is greater than the assumed rate, that year's annual pension expense is not affected. Rather this gain reduces future
pension expense over a period of approximately 12 to 18 years. To the extent the actual rate of return on assets is less than the
assumed rate, that year's annual pension expense is likewise not affected. Rather this loss increases pension expense over
approximately 12 to 18 years.
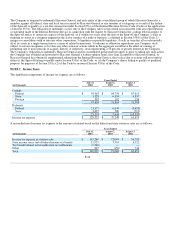
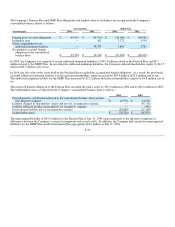
Rate of future compensation increase. The assumed average rate of compensation increase is the average annual compensation
increase expected over the remaining employment periods for the participating employees. The Company utilized a rate of 4.5 percent
for the periods beginning July 31, 2004. This rate is utilized principally in calculating the obligation and annual expense for the
Pension and SERP Plans. The estimated effect of a 0.25 percent increase in the assumed rate of compensation increase would increase
the projected benefit obligation for the Pension Plan by $1.8 million and increase annual pension expense by $0.4 million. The
estimated effect of a 0.25 percent increase in the assumed rate of compensation increase would increase the SERP Plan projected
benefit obligation by $0.8 million and increase the SERP Plan annual expense by $0.2 million.
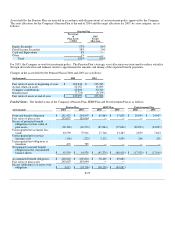
Health care cost trend rate. The assumed health care cost trend rate represents the Company's estimate of the annual rates of change
in the costs of the health care benefits currently provided by the Postretirement Plan. The health care cost trend rate implicitly
considers estimates of health care inflation, changes in health care utilization and delivery patterns, technological advances and
changes in the health status of the plan participants. The Company utilized a health care cost trend rate of 10% as of July 31, 2004,
trending down over time to an ultimate health care cost trend rate of 5%. If the assumed health care cost trend rate were increased one
percentage point, Postretirement Plan costs for 2004 would have been $0.2 million higher and the accumulated postretirement benefit
obligation as of July 31, 2004 would have been $1.8 million higher. If the assumed health care trend rate were decreased one
percentage point, Postretirement Plan costs for 2004 would have been $0.1 million lower and the accumulated postretirement benefit
obligation as of July 31, 2004 would have been $1.5 million lower.
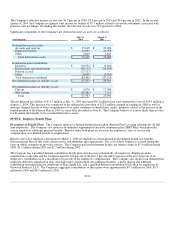
Funding Policy and Plan Assets. The Company's policy is to fund the Pension Plan at or above the minimum required by law. In
2004, the Company made voluntary contributions of $30 million in the second quarter and $15.0 million in the fourth quarter for the
plan year ended July 31, 2003. In addition, the Company made contributions of $5.8 million in 2003 for the plan year ended July 31,
2003. In the third quarter of 2003, the Company made a required contribution of $11.5 million and a voluntary contribution of $13.5
million to the Pension Plan for the plan year ended July 31, 2002. Based upon currently available information, the Company will not
be required to make contributions to the Pension Plan for the plan year ended July 31, 2004.
F-24