Neiman Marcus 2003 Annual Report Download - page 67
Download and view the complete annual report
Please find page 67 of the 2003 Neiman Marcus annual report below. You can navigate through the pages in the report by either clicking on the pages listed below, or by using the keyword search tool below to find specific information within the annual report.-
 1
1 -
2
-
3
-
4
-
5
-
6
-
7
-
8
-
9
-
10
-
11
-
12
-
13
-
14
-
15
-
16
-
17
-
18
-
19
-
20
-
21
-
22
-
23
-
24
-
25
-
26
-
27
-
28
-
29
-
30
-
31
-
32
-
33
-
34
-
35
-
36
-
37
-
38
-
39
-
40
-
41
-
42
-
43
-
44
-
45
-
46
-
47
-
48
-
49
-
50
-
51
-
52
-
53
-
54
-
55
-
56
-
 57
57 -
 58
58 -
 59
59 -
 60
60 -
 61
61 -
 62
62 -
 63
63 -
 64
64 -
 65
65 -
 66
66 -
 67
67 -
 68
68 -
 69
69 -
 70
70 -
 71
71 -
 72
72 -
 73
73 -
 74
74 -
 75
75 -
 76
76 -
 77
77 -
78
-
79
-
80
-
81
-
82
-
83
-
84
-
85
-
86
-
87
-
88
-
89
-
90
-
91
-
92
-
93
-
94
-
95
-
96
-
97
-
98
-
99
-
100
-
101
-
102
-
103
-
104
-
105
-
106
-
107
-
108
-
109
-
110
-
111
-
112
-
113
-
114
-
115
-
116
-
117
-
118
-
119
-
120
-
121
-
122
-
123
-
124
-
125
-
126
-
127
-
128
-
129
-
130
-
131
-
132
-
133
-
134
-
135
-
136
-
137
-
138
-
139
-
140
-
141
-
142
-
143
-
144
-
145
-
146
-
147
-
148
-
149
-
150
-
151
-
152
-
153
-
154
-
155
-
156
-
157
-
158
-
159
-
160
-
161
-
162
-
163
-
164
-
165
-
166
-
167
-
168
-
169
-
170
-
171
-
172
-
173
-
174
-
175
-
176
-
177
-
178
-
179
-
180
-
181
-
182
-
183
-
184
-
185
-
186
-
187
-
188
-
189
-
190
-
191
-
192
-
193
-
194
-
195
-
196
-
197
-
198
-
199
-
200
-
201
-
202
-
203
-
204
-
205
-
206
-
207
-
208
-
209
-
210
-
211
-
212
-
213
-
214
-
215
-
216
-
217
-
218
-
219
-
220
-
221
-
222
-
223
-
224
-
225
-
226
-
227
-
228
-
229
-
230
-
231
-
232
-
233
-
234
-
235
-
236
-
237
-
238
-
239
-
240
-
241
-
242
-
243
-
244
-
245
-
246
-
247
-
248
-
249
-
250
-
251
-
252
-
253
-
254
-
255
-
256
-
257
-
258
-
259
-
260
-
261
-
262
-
263
-
264
-
265
-
266
-
267
-
268
-
269
-
270
-
271
-
272
-
273
-
274
-
275
-
276
-
277
-
278
-
279
-
280
-
281
-
282
-
283
-
284
-
285
-
286
-
287
-
288
-
289
-
290
-
291
-
292
-
293
-
294
-
295
-
296
-
297
-
298
-
299
-
300
-
301
-
302
-
303
-
304
-
305
-
306
-
307
-
308
-
309
-
310
-
311
-
312
-
313
-
314
-
315
-
316
-
317
-
318
-
319
-
320
-
321
-
322
-
323
-
324
-
325
-
326
-
327
-
328
-
329
-
330
-
331
-
332
-
333
-
334
-
335
-
336
-
337
-
338
-
339
-
340
-
341
-
342
-
343
-
344
-
345
-
346
-
347
-
348
-
349
-
350
-
351
-
352
-
353
-
354
-
355
-
356
-
357
 |
 |
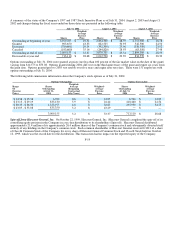
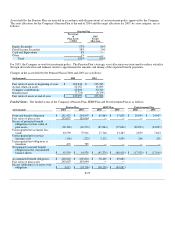
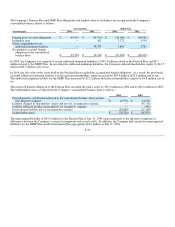
Future minimum rental commitments, excluding renewal options, under capital leases and non-cancelable operating leases are as
follows: fiscal year 2005 – $47.3 million; fiscal year 2006 – $45.2 million; fiscal year 2007 – $40.3 million; fiscal year 2008 – $38.6
million; fiscal year 2009 – $36.5 million; all years thereafter – $567.0 million.
Common area maintenance costs were $11.9 million for 2004, $12.5 million for 2003 and $10.0 million for 2002.
Litigation. The Company is involved in various suits and claims in the ordinary course of business. Management does not believe
that the disposition of any such suits and claims will have a material adverse effect upon the consolidated results of operations, cash
flows or the financial position of the Company.
Other. The Company had approximately $15.0 million of outstanding irrevocable letters of credit relating to purchase commitments
and insurance and other liabilities at July 31, 2004. The Company had approximately $2.8 million in surety bonds at July 31, 2004
relating primarily to merchandise imports, state sales tax and utility requirements.
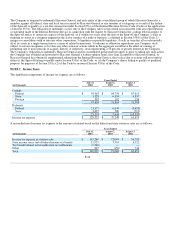
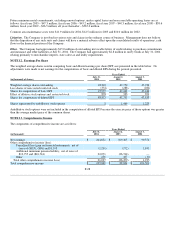
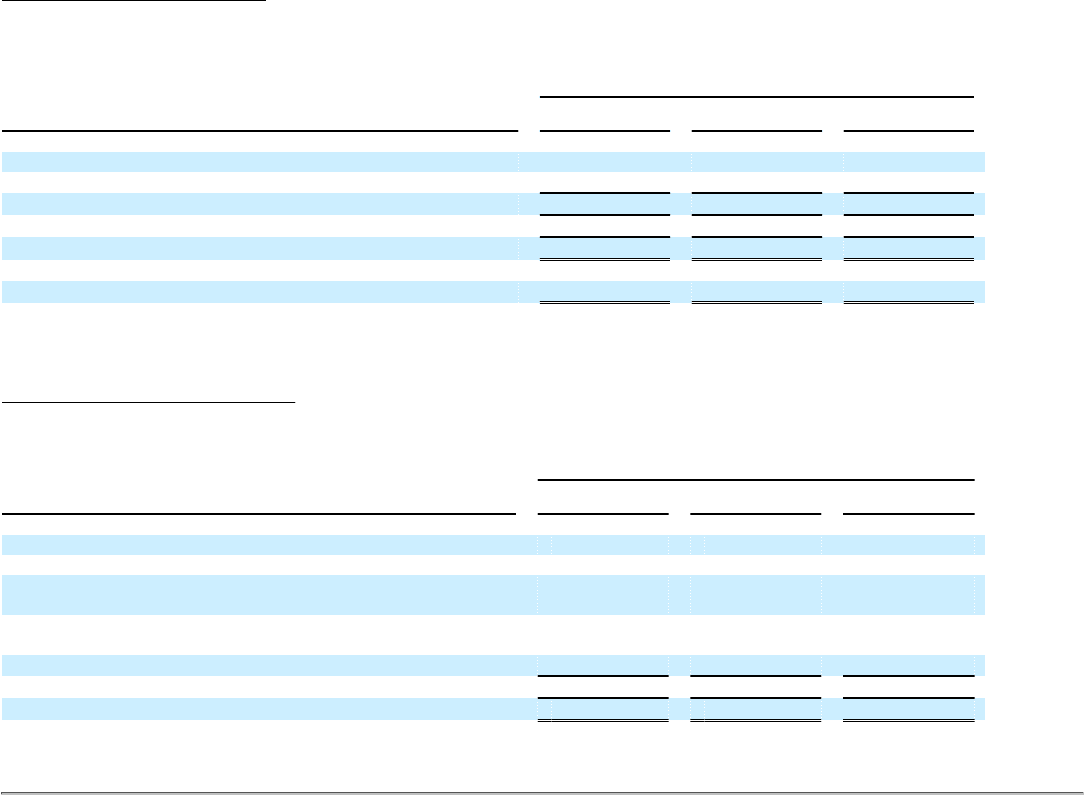
NOTE 12. Earnings Per Share
The weighted average shares used in computing basic and diluted earnings per share (EPS) are presented in the table below. No
adjustments were made to net earnings for the computations of basic and diluted EPS during the periods presented.
Years Ended
(in thousands of shares)
July 31,
2004
August 2,
2003
August 3,
2002
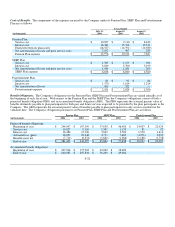
Weighted average shares outstanding 48,349 47,750 47,726
Less shares of non-vested restricted stock (352)(288)(282)
Shares for computation of basic EPS 47,997 47,462 47,444
Effect of dilutive stock options and restricted stock 876 333 391
Shares for computation of diluted EPS 48,873 47,795 47,835
Shares represented by antidilutive stock options 8 1,469 1,223
Antidilutive stock options were not included in the computation of diluted EPS because the exercise price of those options was greater
than the average market price of the common shares.
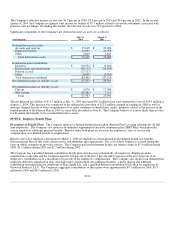
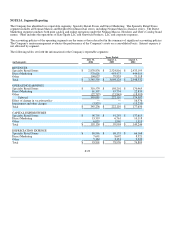
NOTE 13. Comprehensive Income
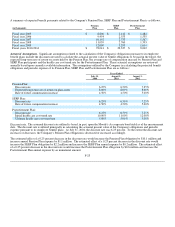
The components of comprehensive income are as follows:
Years Ended
(in thousands)
July 31,
2004
August 2,
2003
August 3,
2002
Net earnings $ 204,832 $ 109,303 $ 99,574
Other comprehensive income (loss):
Unrealized (loss) gain on financial instruments, net of
taxes of ($815), ($96) and $1,193 (1,290) (172) 1,945
Additional minimum pension liability, net of taxes of
$13,755 and ($16,744) 22,071 (26,744) —
Other 256 437 (10)
Total other comprehensive income (loss) 21,037 (26,479)1,935
Total comprehensive income $ 225,869 $ 82,824 $ 101,509
F-28