Neiman Marcus 2003 Annual Report Download - page 16
Download and view the complete annual report
Please find page 16 of the 2003 Neiman Marcus annual report below. You can navigate through the pages in the report by either clicking on the pages listed below, or by using the keyword search tool below to find specific information within the annual report.-
 1
1 -
2
-
3
-
4
-
5
-
 6
6 -
 7
7 -
 8
8 -
 9
9 -
 10
10 -
 11
11 -
 12
12 -
 13
13 -
 14
14 -
 15
15 -
 16
16 -
 17
17 -
 18
18 -
 19
19 -
 20
20 -
 21
21 -
 22
22 -
 23
23 -
 24
24 -
 25
25 -
 26
26 -
27
-
28
-
29
-
30
-
31
-
32
-
33
-
34
-
35
-
36
-
37
-
38
-
39
-
40
-
41
-
42
-
43
-
44
-
45
-
46
-
47
-
48
-
49
-
50
-
51
-
52
-
53
-
54
-
55
-
56
-
57
-
58
-
59
-
60
-
61
-
62
-
63
-
64
-
65
-
66
-
67
-
68
-
69
-
70
-
71
-
72
-
73
-
74
-
75
-
76
-
77
-
78
-
79
-
80
-
81
-
82
-
83
-
84
-
85
-
86
-
87
-
88
-
89
-
90
-
91
-
92
-
93
-
94
-
95
-
96
-
97
-
98
-
99
-
100
-
101
-
102
-
103
-
104
-
105
-
106
-
107
-
108
-
109
-
110
-
111
-
112
-
113
-
114
-
115
-
116
-
117
-
118
-
119
-
120
-
121
-
122
-
123
-
124
-
125
-
126
-
127
-
128
-
129
-
130
-
131
-
132
-
133
-
134
-
135
-
136
-
137
-
138
-
139
-
140
-
141
-
142
-
143
-
144
-
145
-
146
-
147
-
148
-
149
-
150
-
151
-
152
-
153
-
154
-
155
-
156
-
157
-
158
-
159
-
160
-
161
-
162
-
163
-
164
-
165
-
166
-
167
-
168
-
169
-
170
-
171
-
172
-
173
-
174
-
175
-
176
-
177
-
178
-
179
-
180
-
181
-
182
-
183
-
184
-
185
-
186
-
187
-
188
-
189
-
190
-
191
-
192
-
193
-
194
-
195
-
196
-
197
-
198
-
199
-
200
-
201
-
202
-
203
-
204
-
205
-
206
-
207
-
208
-
209
-
210
-
211
-
212
-
213
-
214
-
215
-
216
-
217
-
218
-
219
-
220
-
221
-
222
-
223
-
224
-
225
-
226
-
227
-
228
-
229
-
230
-
231
-
232
-
233
-
234
-
235
-
236
-
237
-
238
-
239
-
240
-
241
-
242
-
243
-
244
-
245
-
246
-
247
-
248
-
249
-
250
-
251
-
252
-
253
-
254
-
255
-
256
-
257
-
258
-
259
-
260
-
261
-
262
-
263
-
264
-
265
-
266
-
267
-
268
-
269
-
270
-
271
-
272
-
273
-
274
-
275
-
276
-
277
-
278
-
279
-
280
-
281
-
282
-
283
-
284
-
285
-
286
-
287
-
288
-
289
-
290
-
291
-
292
-
293
-
294
-
295
-
296
-
297
-
298
-
299
-
300
-
301
-
302
-
303
-
304
-
305
-
306
-
307
-
308
-
309
-
310
-
311
-
312
-
313
-
314
-
315
-
316
-
317
-
318
-
319
-
320
-
321
-
322
-
323
-
324
-
325
-
326
-
327
-
328
-
329
-
330
-
331
-
332
-
333
-
334
-
335
-
336
-
337
-
338
-
339
-
340
-
341
-
342
-
343
-
344
-
345
-
346
-
347
-
348
-
349
-
350
-
351
-
352
-
353
-
354
-
355
-
356
-
357
 |
 |

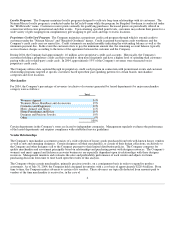
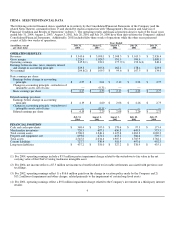
Set forth in the following table is certain summary information with respect to the Company's operations for the most recent three
fiscal years.
Years Ended
(dollars in millions)
July 31,
2004
August 2,
2003
August 3,
2002
REVENUES
Specialty Retail Stores $ 2,870.9 $ 2,524.8 $ 2,433.2
Direct Marketing 570.6 493.5 444.0
Other (1) 104.1 79.8 71.1
Total $ 3,545.6 $ 3,098.1 $ 2,948.3
OPERATING EARNINGS
Specialty Retail Stores $ 310.6 $ 198.2 $ 170.5
Direct Marketing 61.3 45.8 22.8
Other (1) (22.8) (21.9) (19.0)
Effect of change in vacation policy — — 16.6
Impairment and other charges (3.9)— (13.2)
Total $ 345.2 $ 222.1 $ 177.7
OPERATING EARNINGS MARGIN
Specialty Retail Stores 10.8% 7.9% 7.0%
Direct Marketing 10.7% 9.3% 5.1%
Total 9.7% 7.2% 6.0%
COMPARABLE REVENUES (2)
Specialty Retail Stores 13.2% 1.8% (5.3)%
Direct Marketing 15.6% 12.5% 0.2%
Total 14.0% 3.8% (4.6)%
STORE COUNT (3)
Neiman Marcus and Bergdorf Goodman stores:
Open at beginning of period 37 35 34
Opened during the period — 2 1
Open at end of period 37 37 35
Clearance centers:
Open at beginning of period 14 12 10
Opened during the period — 2 2
Open at end of period 14 14 12
(1) Other includes the operations of the Brand Development Companies and corporate expenses.
(2) Comparable revenues include 1) revenues derived from the Company's retail stores open for more than 52 weeks, including stores
that have been relocated or expanded, 2) revenues from the Company's Direct Marketing operation and 3) revenues from the
Company's Brand Development Companies. Comparable revenues exclude the revenues of closed stores. The calculation of the
change in comparable revenues for 2003 is based on revenues for the 52 weeks ended August 2, 2003 compared to revenues for the
52 weeks ended July 27, 2002.
(3) The Company's Neiman Marcus Galleries stores have been excluded. The Company previously opened three Galleries stores in
the second quarter of fiscal year 1999 and in the first quarter of fiscal year 2000. One of these stores was closed in the third quarter
of 2002 and the remaining two stores were closed in the second quarter of 2004.
13