Neiman Marcus 2003 Annual Report Download - page 60
Download and view the complete annual report
Please find page 60 of the 2003 Neiman Marcus annual report below. You can navigate through the pages in the report by either clicking on the pages listed below, or by using the keyword search tool below to find specific information within the annual report.-
 1
1 -
2
-
3
-
4
-
5
-
6
-
7
-
8
-
9
-
10
-
11
-
12
-
13
-
14
-
15
-
16
-
17
-
18
-
19
-
20
-
21
-
22
-
23
-
24
-
25
-
26
-
27
-
28
-
29
-
30
-
31
-
32
-
33
-
34
-
35
-
36
-
37
-
38
-
39
-
40
-
41
-
42
-
43
-
44
-
45
-
46
-
47
-
48
-
49
-
 50
50 -
 51
51 -
 52
52 -
 53
53 -
 54
54 -
 55
55 -
 56
56 -
 57
57 -
 58
58 -
 59
59 -
 60
60 -
 61
61 -
 62
62 -
 63
63 -
 64
64 -
 65
65 -
 66
66 -
 67
67 -
 68
68 -
 69
69 -
 70
70 -
71
-
72
-
73
-
74
-
75
-
76
-
77
-
78
-
79
-
80
-
81
-
82
-
83
-
84
-
85
-
86
-
87
-
88
-
89
-
90
-
91
-
92
-
93
-
94
-
95
-
96
-
97
-
98
-
99
-
100
-
101
-
102
-
103
-
104
-
105
-
106
-
107
-
108
-
109
-
110
-
111
-
112
-
113
-
114
-
115
-
116
-
117
-
118
-
119
-
120
-
121
-
122
-
123
-
124
-
125
-
126
-
127
-
128
-
129
-
130
-
131
-
132
-
133
-
134
-
135
-
136
-
137
-
138
-
139
-
140
-
141
-
142
-
143
-
144
-
145
-
146
-
147
-
148
-
149
-
150
-
151
-
152
-
153
-
154
-
155
-
156
-
157
-
158
-
159
-
160
-
161
-
162
-
163
-
164
-
165
-
166
-
167
-
168
-
169
-
170
-
171
-
172
-
173
-
174
-
175
-
176
-
177
-
178
-
179
-
180
-
181
-
182
-
183
-
184
-
185
-
186
-
187
-
188
-
189
-
190
-
191
-
192
-
193
-
194
-
195
-
196
-
197
-
198
-
199
-
200
-
201
-
202
-
203
-
204
-
205
-
206
-
207
-
208
-
209
-
210
-
211
-
212
-
213
-
214
-
215
-
216
-
217
-
218
-
219
-
220
-
221
-
222
-
223
-
224
-
225
-
226
-
227
-
228
-
229
-
230
-
231
-
232
-
233
-
234
-
235
-
236
-
237
-
238
-
239
-
240
-
241
-
242
-
243
-
244
-
245
-
246
-
247
-
248
-
249
-
250
-
251
-
252
-
253
-
254
-
255
-
256
-
257
-
258
-
259
-
260
-
261
-
262
-
263
-
264
-
265
-
266
-
267
-
268
-
269
-
270
-
271
-
272
-
273
-
274
-
275
-
276
-
277
-
278
-
279
-
280
-
281
-
282
-
283
-
284
-
285
-
286
-
287
-
288
-
289
-
290
-
291
-
292
-
293
-
294
-
295
-
296
-
297
-
298
-
299
-
300
-
301
-
302
-
303
-
304
-
305
-
306
-
307
-
308
-
309
-
310
-
311
-
312
-
313
-
314
-
315
-
316
-
317
-
318
-
319
-
320
-
321
-
322
-
323
-
324
-
325
-
326
-
327
-
328
-
329
-
330
-
331
-
332
-
333
-
334
-
335
-
336
-
337
-
338
-
339
-
340
-
341
-
342
-
343
-
344
-
345
-
346
-
347
-
348
-
349
-
350
-
351
-
352
-
353
-
354
-
355
-
356
-
357
 |
 |

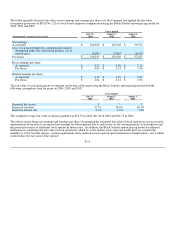
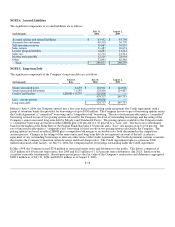
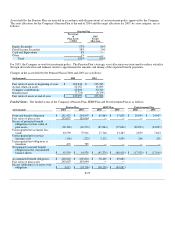
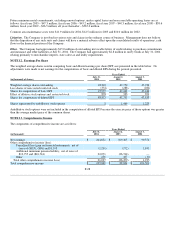
The Company's effective income tax rate was 36.7 percent in 2004, 38.5 percent in 2003 and 38.0 percent in 2002. In the second
quarter of 2004, the Company recognized a net income tax benefit of $7.5 million related to favorable settlements associated with
previous state tax filings. Excluding this benefit, the effective tax rate was 39.0 percent for 2004.
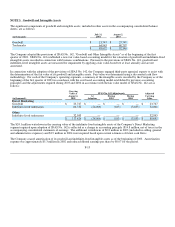
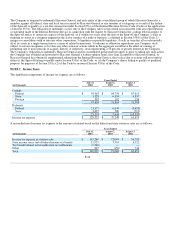
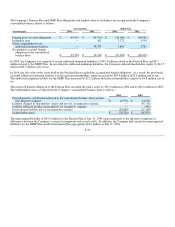
Significant components of the Company's net deferred income tax asset are as follows:
(in thousands)
July 31,
2004
August 2,
2003
Deferred income tax assets:
Accruals and reserves $ 27,618 $ 29,096
Employee benefits 42,891 41,079
Other 2,629 1,845
Total deferred tax assets $ 73,138 $ 72,020
Deferred income tax liabilities:
Inventory $ (10,951) $ (6,602)
Depreciation and amortization (49,133) (36,803)
Pension accrual (17,517) —
Other (6,840)(3,714)
Total deferred tax liabilities (84,441)(47,119)
Net deferred income tax (liability) asset $ (11,303)$ 24,901
Net deferred income tax (liability) asset:
Current $ 9,078 $ 17,586
Non-current (20,381)7,315
Total $ (11,303)$ 24,901
The net deferred tax liability of $11.3 million at July 31, 2004 increased $36.2 million from a net deferred tax asset of $24.9 million at
August 2, 2003. This increase was comprised of the deferred tax provision of $23.3 million charged to earnings in 2004 as well as
amounts charged directly to other comprehensive loss in the statement of shareholders' equity, primarily related to the increase in the
funded position of the Pension Plan in 2004 (as more fully described in Note 8). The Company believes it is more likely than not that
it will realize the benefits of its recorded deferred tax assets.
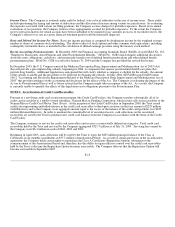
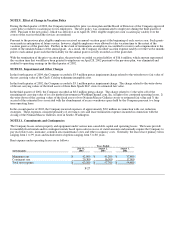
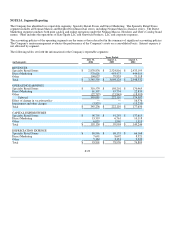
NOTE 8. Employee Benefit Plans
Description of Benefit Plans. The Company sponsors a defined benefit pension plan (Pension Plan) covering substantially all full-
time employees. The Company also sponsors an unfunded supplemental executive retirement plan (SERP Plan) which provides
certain employees additional pension benefits. Benefits under both plans are based on the employees' years of service and
compensation over defined periods of employment.
Retirees and active employees hired prior to March 1, 1989 are eligible for certain limited postretirement health care benefits
(Postretirement Plan) if they meet certain service and minimum age requirements. The cost of these benefits is accrued during the
years in which an employee provides services. The Company paid postretirement health care benefit claims of $1.8 million during
2004, $2.3 million during 2003 and $1.7 million during 2002.
The Company has a qualified defined contribution 401(k) plan, which covers substantially all employees. Employees make
contributions to the plan and the Company matches 100 percent of the first 2 percent and 25 percent of the next 4 percent of an
employee's contribution up to a maximum of 6 percent of the employee's compensation. The Company also sponsors an unfunded key
employee deferred compensation plan, which provides certain employees additional benefits, a profit sharing and a defined
contribution retirement plan for employees of Kate Spade LLC and a qualified defined contribution 401(k) plan for employees of
Gurwitch Products, LLC. The Company's aggregate contributions to these plans were approximately $9.5 million for 2004, $9.3
million for 2003 and $8.9 million for 2002.
F-21