Neiman Marcus 2003 Annual Report Download - page 48
Download and view the complete annual report
Please find page 48 of the 2003 Neiman Marcus annual report below. You can navigate through the pages in the report by either clicking on the pages listed below, or by using the keyword search tool below to find specific information within the annual report.-
 1
1 -
2
-
3
-
4
-
5
-
6
-
7
-
8
-
9
-
10
-
11
-
12
-
13
-
14
-
15
-
16
-
17
-
18
-
19
-
20
-
21
-
22
-
23
-
24
-
25
-
26
-
27
-
28
-
29
-
30
-
31
-
32
-
33
-
34
-
35
-
36
-
37
-
 38
38 -
 39
39 -
 40
40 -
 41
41 -
 42
42 -
 43
43 -
 44
44 -
 45
45 -
 46
46 -
 47
47 -
 48
48 -
 49
49 -
 50
50 -
 51
51 -
 52
52 -
 53
53 -
 54
54 -
 55
55 -
 56
56 -
 57
57 -
 58
58 -
59
-
60
-
61
-
62
-
63
-
64
-
65
-
66
-
67
-
68
-
69
-
70
-
71
-
72
-
73
-
74
-
75
-
76
-
77
-
78
-
79
-
80
-
81
-
82
-
83
-
84
-
85
-
86
-
87
-
88
-
89
-
90
-
91
-
92
-
93
-
94
-
95
-
96
-
97
-
98
-
99
-
100
-
101
-
102
-
103
-
104
-
105
-
106
-
107
-
108
-
109
-
110
-
111
-
112
-
113
-
114
-
115
-
116
-
117
-
118
-
119
-
120
-
121
-
122
-
123
-
124
-
125
-
126
-
127
-
128
-
129
-
130
-
131
-
132
-
133
-
134
-
135
-
136
-
137
-
138
-
139
-
140
-
141
-
142
-
143
-
144
-
145
-
146
-
147
-
148
-
149
-
150
-
151
-
152
-
153
-
154
-
155
-
156
-
157
-
158
-
159
-
160
-
161
-
162
-
163
-
164
-
165
-
166
-
167
-
168
-
169
-
170
-
171
-
172
-
173
-
174
-
175
-
176
-
177
-
178
-
179
-
180
-
181
-
182
-
183
-
184
-
185
-
186
-
187
-
188
-
189
-
190
-
191
-
192
-
193
-
194
-
195
-
196
-
197
-
198
-
199
-
200
-
201
-
202
-
203
-
204
-
205
-
206
-
207
-
208
-
209
-
210
-
211
-
212
-
213
-
214
-
215
-
216
-
217
-
218
-
219
-
220
-
221
-
222
-
223
-
224
-
225
-
226
-
227
-
228
-
229
-
230
-
231
-
232
-
233
-
234
-
235
-
236
-
237
-
238
-
239
-
240
-
241
-
242
-
243
-
244
-
245
-
246
-
247
-
248
-
249
-
250
-
251
-
252
-
253
-
254
-
255
-
256
-
257
-
258
-
259
-
260
-
261
-
262
-
263
-
264
-
265
-
266
-
267
-
268
-
269
-
270
-
271
-
272
-
273
-
274
-
275
-
276
-
277
-
278
-
279
-
280
-
281
-
282
-
283
-
284
-
285
-
286
-
287
-
288
-
289
-
290
-
291
-
292
-
293
-
294
-
295
-
296
-
297
-
298
-
299
-
300
-
301
-
302
-
303
-
304
-
305
-
306
-
307
-
308
-
309
-
310
-
311
-
312
-
313
-
314
-
315
-
316
-
317
-
318
-
319
-
320
-
321
-
322
-
323
-
324
-
325
-
326
-
327
-
328
-
329
-
330
-
331
-
332
-
333
-
334
-
335
-
336
-
337
-
338
-
339
-
340
-
341
-
342
-
343
-
344
-
345
-
346
-
347
-
348
-
349
-
350
-
351
-
352
-
353
-
354
-
355
-
356
-
357
 |
 |

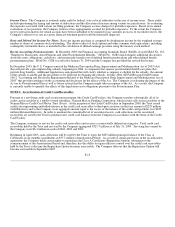
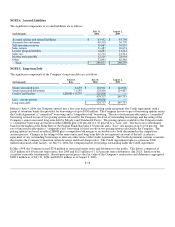
Forward Exchange Contracts. The Company enters into forward exchange contracts to hedge forecasted inventory purchases
denominated in foreign currencies. The purpose of the hedging activities is to minimize the effect of foreign exchange rate movements
on cash flows. The settlement terms of the forward contracts, including amount, currency and maturity, correspond with the payment
terms for purchases of merchandise inventories. The forward exchange contracts represent derivative instruments and are recorded at
fair value in the accompanying Consolidated Financial Statements. These contracts have been designated and accounted for as cash
flow hedges. Gains and losses related to the Company's foreign currency exchange contracts that qualify as hedges are deferred and
recognized in cost of goods sold in the period the inventory is sold.
As of July 31, 2004, the Company had foreign currency contracts in the form of forward exchange contracts in the amount of
approximately $21.8 million. The contracts have varying maturity dates through February 2005. At July 31, 2004, the fair value of the
Company's outstanding foreign currency exchange contracts was a liability of approximately $0.9 million. This amount, net of taxes
($0.5 million), is reflected in other comprehensive income in the accompanying consolidated statements of shareholders' equity.
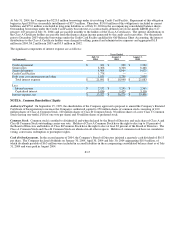
Long-lived Assets. Property and equipment are stated at historical cost less accumulated depreciation. For financial reporting
purposes, depreciation is computed principally using the straight-line method over the estimated useful lives of the assets. Buildings
and improvements are depreciated over 5 to 30 years while fixtures and equipment are depreciated over 3 to 15 years. Costs incurred
for the development of internal computer software are capitalized and amortized using the straight-line method over 3 to 10 years.
The Company receives contributions from developers and merchandise vendors to fund building improvements and the construction
of vendor boutiques in the Company's retail stores. Such contributions are netted against the Company's capital expenditures and
aggregated $11.1 million in 2004, $35.2 million in 2003 and $25.9 million in 2002.
To the extent the Company remodels or otherwise replaces or disposes of property and equipment prior to the end of the assigned
depreciable lives, the Company could realize a loss or gain on the disposition. To the extent assets continue to be used beyond their
assigned depreciable lives, no depreciation expense is incurred. The Company reassesses the depreciable lives of its long-lived assets
in an effort to reduce the risk of significant losses or gains at disposition and utilization of assets with no depreciation charges. The
reassessment of depreciable lives involves utilizing historical remodel and disposition activity and forward-looking capital expenditure
plans.
Recoverability of the carrying value of store assets is assessed annually and upon the occurrence of certain events (e.g., opening a new
store near an existing store or announcing plans for a store closing). The recoverability assessment requires judgment and estimates of
future store generated cash flows. The underlying estimates of cash flows include estimates for future revenues, gross margin rates
and store expenses and are based upon the stores' past and expected future performance. New stores may require two to five years to
develop a customer base necessary to generate the cash flows of the Company's more mature stores. To the extent management's
estimates for revenue growth and gross margin improvement are not realized, future annual assessments could result in impairment
charges.
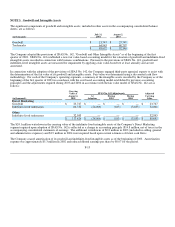
Recoverability of goodwill and intangible assets is assessed annually and upon the occurrence of certain events. The recoverability
assessment requires management to make judgments and estimates regarding fair values. Fair values are determined using estimated
future cash flows, including growth assumptions for future revenues, gross margin rates and other estimates. To the extent that
management's estimates are not realized, future assessments could result in impairment charges.
Benefit Plans. The Company sponsors a noncontributory defined benefit pension plan (Pension Plan) covering substantially all full-
time employees and an unfunded supplemental executive retirement plan (SERP Plan) which provides certain employees additional
pension benefits. In calculating its obligations and related expense, the Company makes various assumptions and estimates, after
consulting with outside actuaries and advisors. The annual determination of expense involves calculating the estimated total benefits
ultimately payable to plan participants and allocating this cost to the periods in which services are expected to be rendered. The
Company uses the projected unit credit method in recognizing pension liabilities. The Pension and SERP Plans are valued annually as
of the beginning of each fiscal year.
F-9