Neiman Marcus 2003 Annual Report Download - page 64
Download and view the complete annual report
Please find page 64 of the 2003 Neiman Marcus annual report below. You can navigate through the pages in the report by either clicking on the pages listed below, or by using the keyword search tool below to find specific information within the annual report.-
 1
1 -
2
-
3
-
4
-
5
-
6
-
7
-
8
-
9
-
10
-
11
-
12
-
13
-
14
-
15
-
16
-
17
-
18
-
19
-
20
-
21
-
22
-
23
-
24
-
25
-
26
-
27
-
28
-
29
-
30
-
31
-
32
-
33
-
34
-
35
-
36
-
37
-
38
-
39
-
40
-
41
-
42
-
43
-
44
-
45
-
46
-
47
-
48
-
49
-
50
-
51
-
52
-
53
-
 54
54 -
 55
55 -
 56
56 -
 57
57 -
 58
58 -
 59
59 -
 60
60 -
 61
61 -
 62
62 -
 63
63 -
 64
64 -
 65
65 -
 66
66 -
 67
67 -
 68
68 -
 69
69 -
 70
70 -
 71
71 -
 72
72 -
 73
73 -
 74
74 -
75
-
76
-
77
-
78
-
79
-
80
-
81
-
82
-
83
-
84
-
85
-
86
-
87
-
88
-
89
-
90
-
91
-
92
-
93
-
94
-
95
-
96
-
97
-
98
-
99
-
100
-
101
-
102
-
103
-
104
-
105
-
106
-
107
-
108
-
109
-
110
-
111
-
112
-
113
-
114
-
115
-
116
-
117
-
118
-
119
-
120
-
121
-
122
-
123
-
124
-
125
-
126
-
127
-
128
-
129
-
130
-
131
-
132
-
133
-
134
-
135
-
136
-
137
-
138
-
139
-
140
-
141
-
142
-
143
-
144
-
145
-
146
-
147
-
148
-
149
-
150
-
151
-
152
-
153
-
154
-
155
-
156
-
157
-
158
-
159
-
160
-
161
-
162
-
163
-
164
-
165
-
166
-
167
-
168
-
169
-
170
-
171
-
172
-
173
-
174
-
175
-
176
-
177
-
178
-
179
-
180
-
181
-
182
-
183
-
184
-
185
-
186
-
187
-
188
-
189
-
190
-
191
-
192
-
193
-
194
-
195
-
196
-
197
-
198
-
199
-
200
-
201
-
202
-
203
-
204
-
205
-
206
-
207
-
208
-
209
-
210
-
211
-
212
-
213
-
214
-
215
-
216
-
217
-
218
-
219
-
220
-
221
-
222
-
223
-
224
-
225
-
226
-
227
-
228
-
229
-
230
-
231
-
232
-
233
-
234
-
235
-
236
-
237
-
238
-
239
-
240
-
241
-
242
-
243
-
244
-
245
-
246
-
247
-
248
-
249
-
250
-
251
-
252
-
253
-
254
-
255
-
256
-
257
-
258
-
259
-
260
-
261
-
262
-
263
-
264
-
265
-
266
-
267
-
268
-
269
-
270
-
271
-
272
-
273
-
274
-
275
-
276
-
277
-
278
-
279
-
280
-
281
-
282
-
283
-
284
-
285
-
286
-
287
-
288
-
289
-
290
-
291
-
292
-
293
-
294
-
295
-
296
-
297
-
298
-
299
-
300
-
301
-
302
-
303
-
304
-
305
-
306
-
307
-
308
-
309
-
310
-
311
-
312
-
313
-
314
-
315
-
316
-
317
-
318
-
319
-
320
-
321
-
322
-
323
-
324
-
325
-
326
-
327
-
328
-
329
-
330
-
331
-
332
-
333
-
334
-
335
-
336
-
337
-
338
-
339
-
340
-
341
-
342
-
343
-
344
-
345
-
346
-
347
-
348
-
349
-
350
-
351
-
352
-
353
-
354
-
355
-
356
-
357
 |
 |

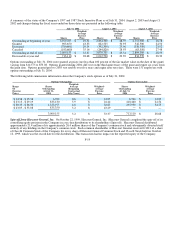
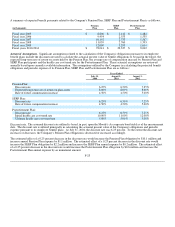
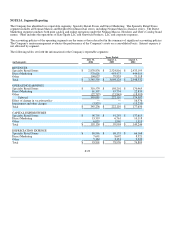
Assets held by the Pension Plan are invested in accordance with the provisions of an investment policy approved by the Company.
The asset allocation for the Company's Pension Plan at the end of 2004 and the target allocation for 2005, by asset category, are as
follows:
Pension Plan
Percentage
of
Plan Assets
at 2004
2005
Target
Allocation
Equity Securities 53% 80%
Fixed Income Securities 38% 20%
Cash and Equivalents 8% —
Other 1%—
Total 100%100%
For 2005, the Company revised its investment policy. The Pension Plan's strategic asset allocation was structured to reduce volatility
through diversification and enhance return to approximate the amounts and timing of the expected benefit payments.
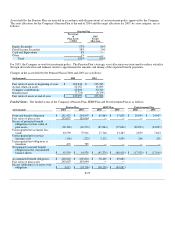
Changes in the assets held by the Pension Plan in 2004 and 2003 are as follows:
(in thousands) 2004 2003
Fair value of assets at beginning of year $ 183,044 $ 145,945
Actual return on assets 22,767 12,693
Company contributions 45,000 30,760
Benefits paid (7,714)(6,354)
Fair value of assets at end of year $ 243,097 $ 183,044
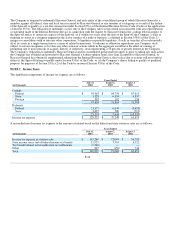
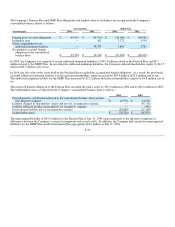
Funded Status. The funded status of the Company's Pension Plan, SERP Plan and Postretirement Plan is as follows:
Pension Plan SERP Plan Postretirement Plan
(in thousands) 2004 2003 2004 2003 2004 2003
Projected benefit obligation $ 281,423 $ 244,997 $ 65,864 $ 57,638 $ 20,994 $ 24,907
Fair value of plan assets 243,097 183,044 — — — —
Excess of projected benefit
obligation over fair value of
plan assets (38,326) (61,953) (65,864) (57,638) (20,994) (24,907)
Unrecognized net actuarial loss
(gain) 83,599 75,921 17,316 13,285 2,859 7,643
Unrecognized prior service
(income) cost (190) (223) 3,172 3,934 206 250
Unrecognized net obligation at
transition 471 785 — — — —
Net prepaid (accrued) benefit
obligation in the consolidated
balance sheets $ 45,554 $ 14,530 $ (45,376)$ (40,419)$ (17,929)$ (17,014)
Accumulated benefit obligation $ 240,082 $ 207,834 $ 56,209 $ 49,082
Fair value of plan assets 243,097 183,044 — —
Excess (deficiency) of assets over
obligation $ 3,015 $ (24,790)$ (56,209)$ (49,082)
F-25