Neiman Marcus 2003 Annual Report Download - page 14
Download and view the complete annual report
Please find page 14 of the 2003 Neiman Marcus annual report below. You can navigate through the pages in the report by either clicking on the pages listed below, or by using the keyword search tool below to find specific information within the annual report.-
 1
1 -
2
-
3
-
 4
4 -
 5
5 -
 6
6 -
 7
7 -
 8
8 -
 9
9 -
 10
10 -
 11
11 -
 12
12 -
 13
13 -
 14
14 -
 15
15 -
 16
16 -
 17
17 -
 18
18 -
 19
19 -
 20
20 -
 21
21 -
 22
22 -
 23
23 -
 24
24 -
25
-
26
-
27
-
28
-
29
-
30
-
31
-
32
-
33
-
34
-
35
-
36
-
37
-
38
-
39
-
40
-
41
-
42
-
43
-
44
-
45
-
46
-
47
-
48
-
49
-
50
-
51
-
52
-
53
-
54
-
55
-
56
-
57
-
58
-
59
-
60
-
61
-
62
-
63
-
64
-
65
-
66
-
67
-
68
-
69
-
70
-
71
-
72
-
73
-
74
-
75
-
76
-
77
-
78
-
79
-
80
-
81
-
82
-
83
-
84
-
85
-
86
-
87
-
88
-
89
-
90
-
91
-
92
-
93
-
94
-
95
-
96
-
97
-
98
-
99
-
100
-
101
-
102
-
103
-
104
-
105
-
106
-
107
-
108
-
109
-
110
-
111
-
112
-
113
-
114
-
115
-
116
-
117
-
118
-
119
-
120
-
121
-
122
-
123
-
124
-
125
-
126
-
127
-
128
-
129
-
130
-
131
-
132
-
133
-
134
-
135
-
136
-
137
-
138
-
139
-
140
-
141
-
142
-
143
-
144
-
145
-
146
-
147
-
148
-
149
-
150
-
151
-
152
-
153
-
154
-
155
-
156
-
157
-
158
-
159
-
160
-
161
-
162
-
163
-
164
-
165
-
166
-
167
-
168
-
169
-
170
-
171
-
172
-
173
-
174
-
175
-
176
-
177
-
178
-
179
-
180
-
181
-
182
-
183
-
184
-
185
-
186
-
187
-
188
-
189
-
190
-
191
-
192
-
193
-
194
-
195
-
196
-
197
-
198
-
199
-
200
-
201
-
202
-
203
-
204
-
205
-
206
-
207
-
208
-
209
-
210
-
211
-
212
-
213
-
214
-
215
-
216
-
217
-
218
-
219
-
220
-
221
-
222
-
223
-
224
-
225
-
226
-
227
-
228
-
229
-
230
-
231
-
232
-
233
-
234
-
235
-
236
-
237
-
238
-
239
-
240
-
241
-
242
-
243
-
244
-
245
-
246
-
247
-
248
-
249
-
250
-
251
-
252
-
253
-
254
-
255
-
256
-
257
-
258
-
259
-
260
-
261
-
262
-
263
-
264
-
265
-
266
-
267
-
268
-
269
-
270
-
271
-
272
-
273
-
274
-
275
-
276
-
277
-
278
-
279
-
280
-
281
-
282
-
283
-
284
-
285
-
286
-
287
-
288
-
289
-
290
-
291
-
292
-
293
-
294
-
295
-
296
-
297
-
298
-
299
-
300
-
301
-
302
-
303
-
304
-
305
-
306
-
307
-
308
-
309
-
310
-
311
-
312
-
313
-
314
-
315
-
316
-
317
-
318
-
319
-
320
-
321
-
322
-
323
-
324
-
325
-
326
-
327
-
328
-
329
-
330
-
331
-
332
-
333
-
334
-
335
-
336
-
337
-
338
-
339
-
340
-
341
-
342
-
343
-
344
-
345
-
346
-
347
-
348
-
349
-
350
-
351
-
352
-
353
-
354
-
355
-
356
-
357
 |
 |

handbags, jewelry and other categories are typically ordered 3-6 months in advance. As a result, inherent in the Company's successful
execution of its business plans is its ability both to predict the fashion trends that will be of interest to its customers and to anticipate
future spending patterns of its customer base.
The Company monitors the sales performance of its inventories throughout each season. The Company seeks to order additional
goods to supplement its original purchasing decisions when the level of customer demand is higher than originally anticipated.
However, in certain merchandise categories, particularly fashion apparel, the Company's ability to purchase additional goods can be
limited. This can result in lost sales to the Company in the event of higher than anticipated demand of the fashion goods offered by
the Company or a higher than anticipated level of consumer spending. Conversely, in the event the Company buys fashion goods that
are not accepted by the customer or the level of consumer spending is less than the Company anticipated, the Company typically
incurs a higher than anticipated level of markdowns, net of vendor allowances, to sell the goods that remain at the end of the season,
resulting in lower operating profits. The Company believes that the experience of its merchandising and selling organizations helps to
minimize the inherent risk in predicting fashion trends.
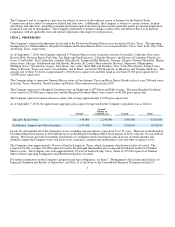
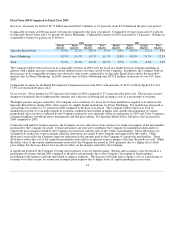
Fiscal Year 2004 Highlights
The Company's operating results for fiscal year 2004 were substantially better than fiscal year 2003.
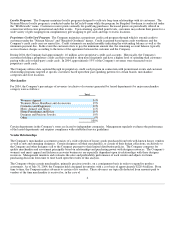
• Revenues – Revenues for 2004 were $3.5 billion, the highest in the Company's history. Revenues increased 14.4% in 2004,
with double digit increases in comparable store sales in all four quarters. Comparable revenues percentage increases by
quarter for 2004 were:
First quarter 10.7%
Second quarter 12.2%
Third quarter 21.4%
Fourth quarter 12.5%
• Margins – Margins increased to 34.5% of revenues in 2004 from 33.1% in 2003. This increase is reflective of the high level
of acceptance and demand for the fashion goods offered by the Company as well as the Company's purchasing efforts that
resulted in the close alignment of purchases to customer demand and the resulting lower level of markdowns.
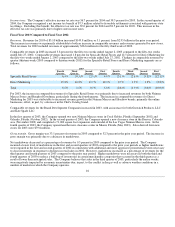
• Selling, general and administrative expenses – Selling, general and administrative (SG&A) expenses decreased to 24.7%
of revenues from 25.9% in 2003. This decrease was attributable to both the leveraging of fixed expenses over the higher
revenue base and the control and containment of variable expenses.
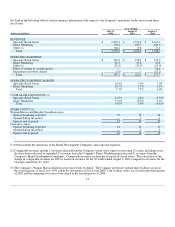
• Operating earnings – Operating earnings increased 55.4% in 2004, representing 9.7% of revenues in 2004 compared to
7.2% in 2003. Operating earnings were 10.8% of revenues for Specialty Retail Stores and 10.7% of revenues for Direct
Marketing.
11