Memorex 2012 Annual Report Download - page 79
Download and view the complete annual report
Please find page 79 of the 2012 Memorex annual report below. You can navigate through the pages in the report by either clicking on the pages listed below, or by using the keyword search tool below to find specific information within the annual report.-
 1
1 -
2
-
3
-
4
-
5
-
6
-
7
-
8
-
9
-
10
-
11
-
12
-
13
-
14
-
15
-
16
-
17
-
18
-
19
-
20
-
21
-
22
-
23
-
24
-
25
-
26
-
27
-
28
-
29
-
30
-
31
-
32
-
33
-
34
-
35
-
36
-
37
-
38
-
39
-
40
-
41
-
42
-
43
-
44
-
45
-
46
-
47
-
48
-
49
-
50
-
51
-
52
-
53
-
54
-
55
-
56
-
57
-
58
-
59
-
60
-
61
-
62
-
63
-
64
-
65
-
66
-
67
-
68
-
 69
69 -
 70
70 -
 71
71 -
 72
72 -
 73
73 -
 74
74 -
 75
75 -
 76
76 -
 77
77 -
 78
78 -
 79
79 -
 80
80 -
 81
81 -
 82
82 -
 83
83 -
 84
84 -
 85
85 -
 86
86 -
 87
87 -
 88
88 -
 89
89 -
90
-
91
-
92
-
93
-
94
-
95
-
96
-
97
-
98
-
99
-
100
-
101
-
102
-
103
-
104
-
105
-
106
-
107
-
108
-
109
-
110
-
111
-
112
-
113
-
114
-
115
-
116
 |
 |

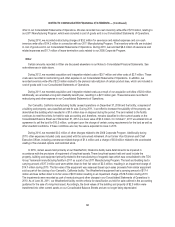
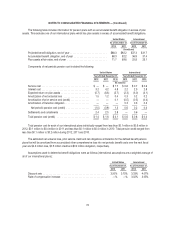
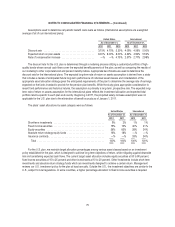
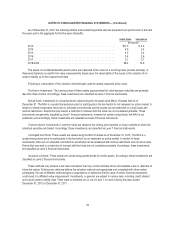
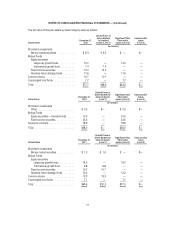
NOTES TO CONSOLIDATED FINANCIAL STATEMENTS — (Continued)
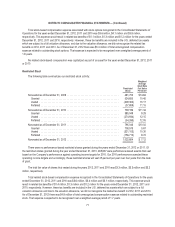
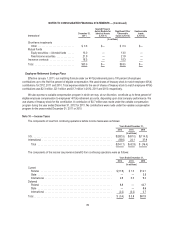
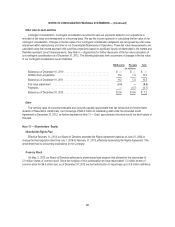
As of December 31, 2012, the following reflects future benefit payments services expected to be paid in each of the next
five years and in the aggregate for the five years thereafter:
United States International
(In millions)
2013 ........................................................... $17.5 $ 2.2
2014 ........................................................... 4.3 2.4
2015 ........................................................... 4.5 2.4
2016 ........................................................... 5.4 2.6
2017 ........................................................... 5.1 2.7
2018-2022 ....................................................... 28.4 14.9
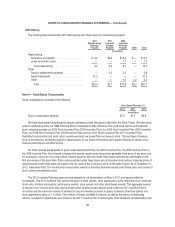
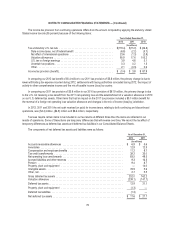
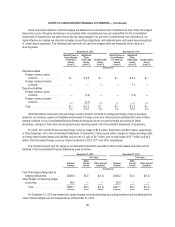
The assets in our defined benefit pension plans are measured at fair value on a recurring basis (at least annually). A
three-level hierarchy is used for fair value measurements based upon the observability of the inputs to the valuation of an
asset or liability as of the measurement date.
Following is a description of the valuation methodologies used for assets measured at fair value.
Short-term investments. The carrying value of these assets approximates fair value because maturities are generally
less than three months. Accordingly, these investments are classified as Level 1 financial instruments.
Mutual funds. Investments in mutual funds are valued using the net asset value (NAV) of shares held as of
December 31. The NAV is a quoted transactional price for participants in the fund which do not represent an active market. In
relation to these investments, there are no unfunded commitments and the shares can be redeemed on a daily basis with
minimal restrictions. Events that may lead to a restriction to transact with the funds are not considered probable. These
investments are generally classified as Level 1 financial instruments, however for certain mutual funds, the NAV is not
published, and accordingly, these investments are classified as Level 2 financial instruments.
Common stocks. Investments in common stock are valued at the closing price reported on major markets on which the
individual securities are traded. Accordingly, these investments are classified as Level 1 financial instruments.
Comingled trust funds. These assets are valued using the NAV of shares as of December 31, 2012. The NAV is a
quoted transactional price for participants in the fund which do not represent an active market. In relation to these
investments, there are no unfunded commitments and shares can be redeemed with minimal restrictions and can do so daily.
Events that may lead to a restriction to transact with the funds are not considered probable. Accordingly, these investments
are classified as Level 2 financial instruments.
Insurance contracts. These assets are valued using quoted prices for similar assets. Accordingly, these investments are
classified as Level 2 financial instruments.
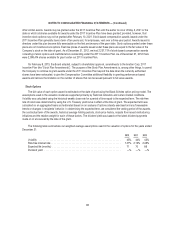
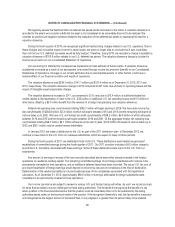
These methods may produce a fair value calculation that may not be indicative of the net realizable value or reflective of
future fair values. Furthermore, while we believe the valuation methods are appropriate and consistent with other market
participants, the use of different methodologies or assumptions to determine the fair value of certain financial instruments
could result in a different value measurement. Investments, in general, are subject to various risks, including credit, interest
and overall market volatility risks. There were no transfers into or out of Level 1 or Level 2 during the years ended
December 31, 2012 or December 31, 2011.
76