Memorex 2012 Annual Report Download - page 37
Download and view the complete annual report
Please find page 37 of the 2012 Memorex annual report below. You can navigate through the pages in the report by either clicking on the pages listed below, or by using the keyword search tool below to find specific information within the annual report.-
 1
1 -
2
-
3
-
4
-
5
-
6
-
7
-
8
-
9
-
10
-
11
-
12
-
13
-
14
-
15
-
16
-
17
-
18
-
19
-
20
-
21
-
22
-
23
-
24
-
25
-
26
-
 27
27 -
 28
28 -
 29
29 -
 30
30 -
 31
31 -
 32
32 -
 33
33 -
 34
34 -
 35
35 -
 36
36 -
 37
37 -
 38
38 -
 39
39 -
 40
40 -
 41
41 -
 42
42 -
 43
43 -
 44
44 -
 45
45 -
 46
46 -
 47
47 -
48
-
49
-
50
-
51
-
52
-
53
-
54
-
55
-
56
-
57
-
58
-
59
-
60
-
61
-
62
-
63
-
64
-
65
-
66
-
67
-
68
-
69
-
70
-
71
-
72
-
73
-
74
-
75
-
76
-
77
-
78
-
79
-
80
-
81
-
82
-
83
-
84
-
85
-
86
-
87
-
88
-
89
-
90
-
91
-
92
-
93
-
94
-
95
-
96
-
97
-
98
-
99
-
100
-
101
-
102
-
103
-
104
-
105
-
106
-
107
-
108
-
109
-
110
-
111
-
112
-
113
-
114
-
115
-
116
 |
 |

Days of inventory supply is calculated using the current period inventory balance divided by an estimate of the inventoriable
portion of cost of goods sold expressed in days.
Our accounts payable balance as of December 31, 2012 was $162.7 million, a decrease of $42.5 million from
$205.2 million as of December 31, 2011. The decrease in accounts payable was mainly due to reduced purchases compared
to the previous year, as well as the timing of payments.
Liquidity and Capital Resources
We have various resources available to us for purposes of managing liquidity and capital needs, including our credit
facility and letters of credit. Our primary sources of liquidity include cash flows generated by the sale of our products, our cash
and cash equivalents and credit capacity under our credit facility. Our primary operating liquidity needs relate to our costs of
goods sold and general operating expenses.
Cash and Cash Equivalents
Cash equivalents consist of highly liquid investments purchased with original maturities of three months or less.
Restricted cash that is related to contractual obligations or restricted by management is included in other assets on our
Consolidated Balance Sheets. At December 31, 2012 restricted cash primarily includes cash acquired from Nexsan that was
previously restricted to specifically fulfill certain obligations of Nexsan.
Analysis of Cash Flows
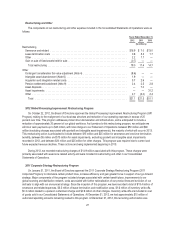
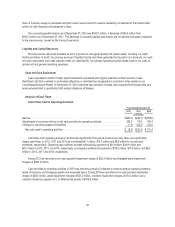
Cash Flows Used In Operating Activities:
Years Ended December 31,
2012 2011 2010
(In millions)
Net loss .................................................................. $(340.7) $(46.7) $(158.5)
Adjustments to reconcile net loss to net cash provided by operating activities .............. 333.5 73.9 185.4
Changes in operating assets and liabilities ........................................ (1.3) (43.5) 124.5
Net cash used in operating activities .......................................... $ (8.5) $(16.3) $ 151.4
Cash flows from operating activities can fluctuate significantly from period to period as many items can significantly
impact cash flows. In 2012, 2011 and 2010 we contributed $5.1 million, $14.2 million and $9.9 million to our pensions
worldwide, respectively. Operating cash outflows included restructuring payments of $8.0 million, $16.9 million and
$9.5 million in 2012, 2011 and 2010, respectively, and litigation settlement payments of $18.5 million, $10.9 million and $8.2
million in 2012, 2011 and 2010, respectively.
During 2012 we recorded a non-cash goodwill impairment charge of $23.3 million and intangible asset impairment
charges of $260.5 million.
Cash provided by operating activities in 2010 was primarily a result of initiatives to improve working capital by lowering
levels of inventory and changing payable and receivable terms. During 2010 we recorded a non-cash goodwill impairment
charge of $23.5 million, asset impairment charges of $31.2 million, inventory impairment charges of $14.2 million and a
valuation allowance against our U.S. deferred tax assets of $105.6 million.
34