Memorex 2012 Annual Report Download - page 65
Download and view the complete annual report
Please find page 65 of the 2012 Memorex annual report below. You can navigate through the pages in the report by either clicking on the pages listed below, or by using the keyword search tool below to find specific information within the annual report.-
 1
1 -
2
-
3
-
4
-
5
-
6
-
7
-
8
-
9
-
10
-
11
-
12
-
13
-
14
-
15
-
16
-
17
-
18
-
19
-
20
-
21
-
22
-
23
-
24
-
25
-
26
-
27
-
28
-
29
-
30
-
31
-
32
-
33
-
34
-
35
-
36
-
37
-
38
-
39
-
40
-
41
-
42
-
43
-
44
-
45
-
46
-
47
-
48
-
49
-
50
-
51
-
52
-
53
-
54
-
 55
55 -
 56
56 -
 57
57 -
 58
58 -
 59
59 -
 60
60 -
 61
61 -
 62
62 -
 63
63 -
 64
64 -
 65
65 -
 66
66 -
 67
67 -
 68
68 -
 69
69 -
 70
70 -
 71
71 -
 72
72 -
 73
73 -
 74
74 -
 75
75 -
76
-
77
-
78
-
79
-
80
-
81
-
82
-
83
-
84
-
85
-
86
-
87
-
88
-
89
-
90
-
91
-
92
-
93
-
94
-
95
-
96
-
97
-
98
-
99
-
100
-
101
-
102
-
103
-
104
-
105
-
106
-
107
-
108
-
109
-
110
-
111
-
112
-
113
-
114
-
115
-
116
 |
 |

NOTES TO CONSOLIDATED FINANCIAL STATEMENTS — (Continued)
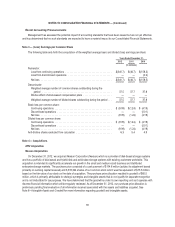
As of December 31, 2012, we had $80.2 million of definite-lived intangible assets subject to amortization and $1.7
million of indefinite-lived intangible assets not subject to amortization. While we believe that the current carrying value of these
assets is recoverable, different assumptions regarding future performance of our businesses could result in significant
impairment losses.
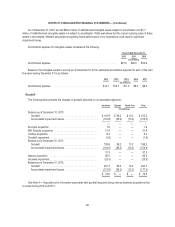
Amortization expense for intangible assets consisted of the following:
Years Ended December 31,
2012 2011 2010
(In millions)
Amortization expense ................................................ $27.5 $26.0 $23.6
Based on the intangible assets in service as of December 31, 2012, estimated amortization expense for each of the next
five years ending December 31 is as follows:
2013 2014 2015 2016 2017
(In millions)
Amortization expense ................................... $14.1 $12.7 $11.2 $9.2 $8.2
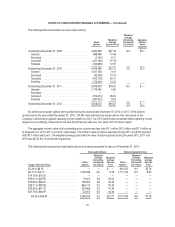
Goodwill
The following table presents the changes in goodwill allocated to our reportable segments:
Americas Europe North Asia Total
(In millions)
Balance as of December 31, 2010:
Goodwill ......................................... $102.9 $ 39.2 $ 10.2 $ 152.3
Accumulated impairment losses ........................ (102.9) (39.2) (10.2) (152.3)
—— — —
Encryptx acquisition ................................... 1.6 — — 1.6
MXI Security acquisition ................................ 21.9 — — 21.9
IronKey acquisition .................................... 9.4 — — 9.4
Goodwill impairment ................................... (1.6) — — (1.6)
Balance as of December 31, 2011:
Goodwill ......................................... 135.8 39.2 10.2 185.2
Accumulated impairment losses ........................ (104.5) (39.2) (10.2) (153.9)
31.3 — — 31.3
Nexsan acquisition .................................... 65.5 — — 65.5
Goodwill impairment ................................... (23.3) — — (23.3)
Balance as of December 31, 2012:
Goodwill ......................................... 201.3 39.2 10.2 250.7
Accumulated impairment losses ........................ (127.8) (39.2) (10.2) (177.2)
$ 73.5 $ — $ — $ 73.5
See Note 4 — Acquisitions for information associated with goodwill acquired during various business acquisitions that
occurred during 2012 and 2011.
62