Memorex 2012 Annual Report Download - page 26
Download and view the complete annual report
Please find page 26 of the 2012 Memorex annual report below. You can navigate through the pages in the report by either clicking on the pages listed below, or by using the keyword search tool below to find specific information within the annual report.-
 1
1 -
2
-
3
-
4
-
5
-
6
-
7
-
8
-
9
-
10
-
11
-
12
-
13
-
14
-
15
-
 16
16 -
 17
17 -
 18
18 -
 19
19 -
 20
20 -
 21
21 -
 22
22 -
 23
23 -
 24
24 -
 25
25 -
 26
26 -
 27
27 -
 28
28 -
 29
29 -
 30
30 -
 31
31 -
 32
32 -
 33
33 -
 34
34 -
 35
35 -
 36
36 -
37
-
38
-
39
-
40
-
41
-
42
-
43
-
44
-
45
-
46
-
47
-
48
-
49
-
50
-
51
-
52
-
53
-
54
-
55
-
56
-
57
-
58
-
59
-
60
-
61
-
62
-
63
-
64
-
65
-
66
-
67
-
68
-
69
-
70
-
71
-
72
-
73
-
74
-
75
-
76
-
77
-
78
-
79
-
80
-
81
-
82
-
83
-
84
-
85
-
86
-
87
-
88
-
89
-
90
-
91
-
92
-
93
-
94
-
95
-
96
-
97
-
98
-
99
-
100
-
101
-
102
-
103
-
104
-
105
-
106
-
107
-
108
-
109
-
110
-
111
-
112
-
113
-
114
-
115
-
116
 |
 |

Executive Summary
Consolidated Results of Operations for the Twelve Months Ended December 31, 2012
• Revenue of $1,099.6 million in 2012 was down 14.8 percent compared with revenue of $1,290.4 million in 2011.
• Gross margin of 18.4% percent in 2012 was up from 16.8% percent in 2011.
• Selling, general and administrative expense was $210.7 million in 2012, up $7.0 million, compared with $203.7
million in 2011.
• Research and development expense was $22.8 million in 2012, up $1.8 million, compared with $21.0 million in
2011.
• We recorded non-cash goodwill impairment charges of $23.3 million in 2012 and $1.6 million in 2011 and recorded
non-cash intangible impairment charges of $260.5 million in 2012.
• Restructuring and other expense was $21.1 million in 2012 and $21.5 million in 2011, from previously announced
restructuring programs.
• Other (income) expense was $5.0 million in 2012, down $4.8 million, compared with $9.8 million in 2011.
• Operating loss was $336.1 million in 2012 compared with an operating loss of $33.1 million in 2011.
• The income tax benefit was $0.4 million in 2012 compared with an income tax provision of $3.8 million in 2011.
Cash Flow/Financial Condition for the Twelve Months Ended December 31, 2012
• Cash and cash equivalents totaled $108.7 million as of December 31, 2012 compared with $223.1 million at
December 31, 2011. The reduction was due mainly to the Nexsan acquisition.
• Cash used in operating activities was $8.5 million for the twelve months ended December 31, 2012 compared with
cash used in operating activities of $16.3 million for the twelve months ended December 31, 2011.
Results of Operations
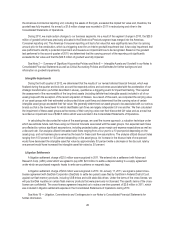
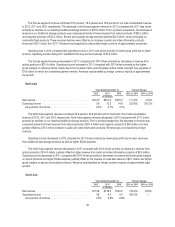
Net Revenue
Years Ended December 31, Percent Change
2012 2011 2010 2012 vs. 2011 2011 vs. 2010
(In millions)
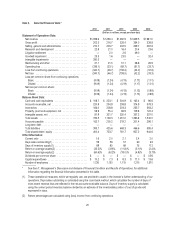
Net revenue ...................................... $1,099.6 $1,290.4 $1,460.9 (14.8)% (11.7)%
Our worldwide revenue in 2012 decreased compared with 2011, driven by declines in our maturing traditional storage
products and our audio and video information products. Several continuing macro-economic factors, including the broad-
based European economic downturn, a soft global IT environment and a weak U.S. retail environment for the products we
sell, had an impact on our revenue in 2012. From a product perspective, the decrease in revenue included declines in
traditional storage products of $158.6 million comprising $85.1 million from optical products, $41.2 million from magnetic
products and $32.3 million from other traditional storage products, as well as decreased revenue from audio and video
information products of $32.2 million. Secure and scalable products remained flat in 2012 compared to 2011 as a $20.4
million decline in commodity flash products, driven by continued market place price degradation, was offset by a $14.3 million
increase in our mobile security products as well as increases in our other secure and scalable products. Revenue for 2012
compared to 2011 was negatively impacted by foreign currency translation of one percent.
Our worldwide revenue in 2011 decreased compared with 2010 due to declines in traditional storage products of
$142.9 million, including $107.4 million from optical products and $20.4 million from magnetic products, as well as
$30.2 million from audio and video information products, driven by planned rationalization of our video products, offset
partially by increases in secure and scalable storage products of $2.6 million. Revenue was positively impacted by foreign
currency translation of four percent.
23