Logitech 2013 Annual Report Download - page 72
Download and view the complete annual report
Please find page 72 of the 2013 Logitech annual report below. You can navigate through the pages in the report by either clicking on the pages listed below, or by using the keyword search tool below to find specific information within the annual report.-
 1
1 -
2
-
3
-
4
-
5
-
6
-
7
-
8
-
9
-
10
-
11
-
12
-
13
-
14
-
15
-
16
-
17
-
18
-
19
-
20
-
21
-
22
-
23
-
24
-
25
-
26
-
27
-
28
-
29
-
30
-
31
-
32
-
33
-
34
-
35
-
36
-
37
-
38
-
39
-
40
-
41
-
42
-
43
-
44
-
45
-
46
-
47
-
48
-
49
-
50
-
51
-
52
-
53
-
54
-
55
-
56
-
57
-
58
-
59
-
60
-
61
-
 62
62 -
 63
63 -
 64
64 -
 65
65 -
 66
66 -
 67
67 -
 68
68 -
 69
69 -
 70
70 -
 71
71 -
 72
72 -
 73
73 -
 74
74 -
 75
75 -
 76
76 -
 77
77 -
 78
78 -
 79
79 -
 80
80 -
 81
81 -
 82
82 -
83
-
84
-
85
-
86
-
87
-
88
-
89
-
90
-
91
-
92
-
93
-
94
-
95
-
96
-
97
-
98
-
99
-
100
-
101
-
102
-
103
-
104
-
105
-
106
-
107
-
108
-
109
-
110
-
111
-
112
-
113
-
114
-
115
-
116
-
117
-
118
-
119
-
120
-
121
-
122
-
123
-
124
-
125
-
126
-
127
-
128
-
129
-
130
-
131
-
132
-
133
-
134
-
135
-
136
-
137
-
138
-
139
-
140
-
141
-
142
-
143
-
144
-
145
-
146
-
147
-
148
-
149
-
150
-
151
-
152
-
153
-
154
-
155
-
156
-
157
-
158
-
159
-
160
-
161
-
162
-
163
-
164
-
165
-
166
-
167
-
168
-
169
-
170
-
171
-
172
-
173
-
174
-
175
-
176
-
177
-
178
-
179
-
180
-
181
-
182
-
183
-
184
-
185
-
186
-
187
-
188
-
189
-
190
-
191
-
192
-
193
-
194
-
195
-
196
-
197
-
198
-
199
-
200
-
201
-
202
-
203
-
204
-
205
-
206
-
207
-
208
-
209
-
210
-
211
-
212
-
213
-
214
-
215
-
216
-
217
-
218
-
219
-
220
-
221
-
222
-
223
-
224
 |
 |

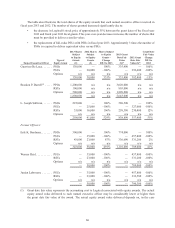
SUMMARY COMPENSATION TABLE
The following table provides information regarding the compensation and benefits earned during fiscal
years 2013, 2012, and 2011 by our named executive officers. For more information, please refer to “Compensation
Disclosure and Analysis,” as well as “Narrative Disclosure to Summary Compensation Table and Grants of Plan-
Based Awards Table.”
Name and Principal Position Year
Salary
($) Bonus ($)
Stock
Awards($)(1)
Option
Awards
($)(1)
Non-equity
Incentive Plan
Compensation
($)(2)
Changes in
Nonqualified
Deferred
Compensation
Earnings($)
All Other
Compensation
($)(3) Total ($)
Guerrino De Luca(4) .....
Chairman of the Board
FY13 500,000 — — 335,400 — — 31,314 866,714
FY12 500,000 — 392,400 — — — 30,306 922,706
FY11 550,000 — 835,500 — 578,000 — 12,168 1,975,668
Bracken P. Darrell(5) .....
President and Chief
Executive Officer
FY13 735,577 — 803,000 4,840,000 — — 226,164 6,604,741
FY12 — — — — — — — —
FY11 — — — — — — — —
L. Joseph Sullivan .......
SeniorVice-President,
Worldwide Operations
FY13 402,000 — 258,390 580,500 — — 12,358 1,253,248
FY12 402,000 — 557,400 — — — 11,762 971,162
FY11 390,000 — 1,117,350 — 308,000 — 10,501 1,825,851
Former Officers:
Erik K. Bardman(6) ......
SeniorVicePresident,
Finance and Chief
Financial Officer
FY13 484,000 — 336,690 774,000 — — 9,553 1,604,243
FY12 440,000 25,000 789,000 — — — 9,278 1,263,278
FY11 420,000 — 1,489,800 — 331,000 — 7,800 2,248,600
Werner Heid(7) ..........
SeniorVicePresident,
Sales and Marketing
FY13 70,153 — — — — — 758,569 828,722
FY12 570,000 — 789,000 — — — 12,331 1,371,331
FY11 570,000 — 1,489,800 — 415,000 — 9,741 2,484,541
Junien Labrousse(8) ......
SeniorVicePresident,
Products
FY13 673,044 — — — — — 170,605 843,649
FY12 804,135 — 790,380 — — — 176,736 1,771,251
FY11 718,588 133,547(9) 1,489,800 — 535,276 — 169,128 3,046,339
(1) These amounts do not represent the actual economic value realized by the named executive officer. Under
SEC rules, the values reported in the “Stock Awards” and “Option Awards” columns reflect the aggregate
grant date fair value of grants of stock options and stock awards to each of the listed officers in the fiscal years
shown. The key assumptions and methodology of valuation of stock options and stock awards are presented
in Note 4 to the Consolidated Financial Statements included in Logitech’s Annual Report to Shareholders.
For FY12: Assuming the highest level of performance is achieved, the maximum possible value of the PSUs
allocated in FY12, using the market value of our shares on the grant date of the PSUs, was: (a) in the case of
Mr.GuerrinoDeLuca,$588,600;(b)inthecaseofMr.ErikBardman,Mr.JunienLabrousseandMr.Werner
Heid,$686,700each;and(c)inthecaseofMr.JosephSullivan,$490,500.
70