Logitech 2013 Annual Report Download - page 176
Download and view the complete annual report
Please find page 176 of the 2013 Logitech annual report below. You can navigate through the pages in the report by either clicking on the pages listed below, or by using the keyword search tool below to find specific information within the annual report.-
 1
1 -
2
-
3
-
4
-
5
-
6
-
7
-
8
-
9
-
10
-
11
-
12
-
13
-
14
-
15
-
16
-
17
-
18
-
19
-
20
-
21
-
22
-
23
-
24
-
25
-
26
-
27
-
28
-
29
-
30
-
31
-
32
-
33
-
34
-
35
-
36
-
37
-
38
-
39
-
40
-
41
-
42
-
43
-
44
-
45
-
46
-
47
-
48
-
49
-
50
-
51
-
52
-
53
-
54
-
55
-
56
-
57
-
58
-
59
-
60
-
61
-
62
-
63
-
64
-
65
-
66
-
67
-
68
-
69
-
70
-
71
-
72
-
73
-
74
-
75
-
76
-
77
-
78
-
79
-
80
-
81
-
82
-
83
-
84
-
85
-
86
-
87
-
88
-
89
-
90
-
91
-
92
-
93
-
94
-
95
-
96
-
97
-
98
-
99
-
100
-
101
-
102
-
103
-
104
-
105
-
106
-
107
-
108
-
109
-
110
-
111
-
112
-
113
-
114
-
115
-
116
-
117
-
118
-
119
-
120
-
121
-
122
-
123
-
124
-
125
-
126
-
127
-
128
-
129
-
130
-
131
-
132
-
133
-
134
-
135
-
136
-
137
-
138
-
139
-
140
-
141
-
142
-
143
-
144
-
145
-
146
-
147
-
148
-
149
-
150
-
151
-
152
-
153
-
154
-
155
-
156
-
157
-
158
-
159
-
160
-
161
-
162
-
163
-
164
-
165
-
 166
166 -
 167
167 -
 168
168 -
 169
169 -
 170
170 -
 171
171 -
 172
172 -
 173
173 -
 174
174 -
 175
175 -
 176
176 -
 177
177 -
 178
178 -
 179
179 -
 180
180 -
 181
181 -
 182
182 -
 183
183 -
 184
184 -
 185
185 -
 186
186 -
187
-
188
-
189
-
190
-
191
-
192
-
193
-
194
-
195
-
196
-
197
-
198
-
199
-
200
-
201
-
202
-
203
-
204
-
205
-
206
-
207
-
208
-
209
-
210
-
211
-
212
-
213
-
214
-
215
-
216
-
217
-
218
-
219
-
220
-
221
-
222
-
223
-
224
 |
 |

LOGITECH INTERNATIONAL S.A.
NOTES TO CONSOLIDATED FINANCIAL STATEMENTS (Continued)
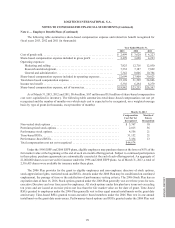
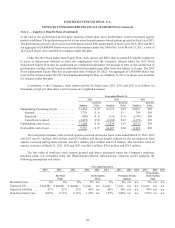
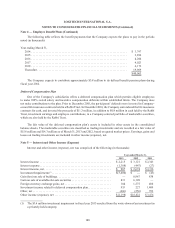
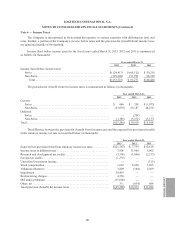
A summary of the Company’s time- and performance-based RSU activity for fiscal years 2013, 2012 and 2011
is as follows (in thousands, except per share values; grant-date fair values are weighted averages):
Year ended March 31,
2013 2012 2011
Number
Grant
Date Fair
Value Number
Grant
Date Fair
Value Number
Grant
Date Fair
Value
Outstanding, beginning of year. . . . . . . . . . . . . . . 4,125 $ 13 2,370 $ 21 514 $18
Time-based RSUs granted . . . . . . . . . . . . . . . . 2,219 $ 7 2,496 $ 9 1,599 $20
Performance-based RSUs granted. . . . . . . . . . 101 $ 6 516 $ 11 538 $28
Vested. . . . . . . . . . . . . . . . . . . . . . . . . . . . . . . . (1,097) $ 11 (399) $ 19 (142) $15
Cancelled or expired . . . . . . . . . . . . . . . . . . . . (706) $ 13 (858) $ 19 (139) $24
Outstanding, end of year . . . . . . . . . . . . . . . . . . . . 4,642 $ 10 4,125 $ 13 2,370 $21
The total pretax intrinsic value (fair value) of RSUs vested during the fiscal years ended March 31, 2013, 2012
and 2011 was $ 8.3 million, $3.8 million and $1.7 million. The tax benefit realized for the tax deduction from RSUs
vested during the fiscal years ended March 31, 2013, 2012 and 2011 was $1.9 million, $0.9 million and $0.2 million.
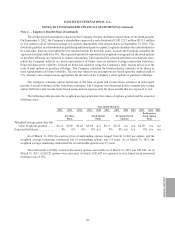
The Company determines the fair value of the time-based RSUs based on the market price on the date of grant.
The fair value of the performance-based RSUs is estimated using the Monte-Carlo simulation model applying the
following assumptions:
Year ended March 31,
2013 2012 2011
Performance-Based RSUs
Dividend yield . . . . . . . . . . . . . . . . . . . . . . . . . . . . . . . . . . . . . . . 0% 0% 0%
Expected life . . . . . . . . . . . . . . . . . . . . . . . . . . . . . . . . . . . . . . . . 3 years 3 years 3 years
Expected volatility . . . . . . . . . . . . . . . . . . . . . . . . . . . . . . . . . . . 47% 49% 51%
Risk-free interest rate . . . . . . . . . . . . . . . . . . . . . . . . . . . . . . . . . 0.31% 0.99% 0.81%
The dividend yield assumption is based on the Company’s history and future expectations of dividend payouts.
The expected life of the performance-based RSUs is the service period at the end of which the RSUs will vest if the
performance conditions are satisfied. The volatility assumption is based on the actual volatility of Logitech’s daily
closing share price over a look-back period equal to the years of expected life. The risk free interest rate is derived
from the yield on US Treasury Bonds for a term of the same number of years as the expected life.
As of March 31, 2013, the grant date fair values of outstanding RSUs ranged from $6 to $28 per RSU, and the
weighted average remaining contractual life was 8.9 years.
Note 4 — Employee Benefit Plans (Continued)
174