Logitech 2013 Annual Report Download - page 103
Download and view the complete annual report
Please find page 103 of the 2013 Logitech annual report below. You can navigate through the pages in the report by either clicking on the pages listed below, or by using the keyword search tool below to find specific information within the annual report.-
 1
1 -
2
-
3
-
4
-
5
-
6
-
7
-
8
-
9
-
10
-
11
-
12
-
13
-
14
-
15
-
16
-
17
-
18
-
19
-
20
-
21
-
22
-
23
-
24
-
25
-
26
-
27
-
28
-
29
-
30
-
31
-
32
-
33
-
34
-
35
-
36
-
37
-
38
-
39
-
40
-
41
-
42
-
43
-
44
-
45
-
46
-
47
-
48
-
49
-
50
-
51
-
52
-
53
-
54
-
55
-
56
-
57
-
58
-
59
-
60
-
61
-
62
-
63
-
64
-
65
-
66
-
67
-
68
-
69
-
70
-
71
-
72
-
73
-
74
-
75
-
76
-
77
-
78
-
79
-
80
-
81
-
82
-
83
-
84
-
85
-
86
-
87
-
88
-
89
-
90
-
91
-
92
-
 93
93 -
 94
94 -
 95
95 -
 96
96 -
 97
97 -
 98
98 -
 99
99 -
 100
100 -
 101
101 -
 102
102 -
 103
103 -
 104
104 -
 105
105 -
 106
106 -
 107
107 -
 108
108 -
 109
109 -
 110
110 -
 111
111 -
 112
112 -
 113
113 -
114
-
115
-
116
-
117
-
118
-
119
-
120
-
121
-
122
-
123
-
124
-
125
-
126
-
127
-
128
-
129
-
130
-
131
-
132
-
133
-
134
-
135
-
136
-
137
-
138
-
139
-
140
-
141
-
142
-
143
-
144
-
145
-
146
-
147
-
148
-
149
-
150
-
151
-
152
-
153
-
154
-
155
-
156
-
157
-
158
-
159
-
160
-
161
-
162
-
163
-
164
-
165
-
166
-
167
-
168
-
169
-
170
-
171
-
172
-
173
-
174
-
175
-
176
-
177
-
178
-
179
-
180
-
181
-
182
-
183
-
184
-
185
-
186
-
187
-
188
-
189
-
190
-
191
-
192
-
193
-
194
-
195
-
196
-
197
-
198
-
199
-
200
-
201
-
202
-
203
-
204
-
205
-
206
-
207
-
208
-
209
-
210
-
211
-
212
-
213
-
214
-
215
-
216
-
217
-
218
-
219
-
220
-
221
-
222
-
223
-
224
 |
 |

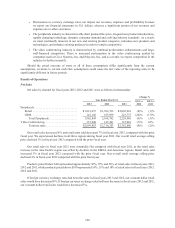
OEM net sales decreased 24% and 17% and units sold decreased 12% in fiscal years 2013 and 2012, compared
with the preceding fiscal years. These declines were primarily due to lower sales in the keyboard/ desktop category
due to product mix changes with a large customer, and lower sales of OEM mice. If foreign currency exchange
rates had been the same in fiscal years 2013 and 2012, our constant dollar OEM sales would have decreased 24%.
If foreign currency exchange rates had been the same in fiscal years 2012 and 2011, our constant dollar OEM sales
would have decreased 18%.
Video conferencing net sales decreased 7% in fiscal year 2013, compared with the prior fiscal year, due to
sales declines in all geographic regions, and were impacted by the slowdown in the overall video conferencing
industry in recent quarters, together with the competitive environment in fiscal year 2013 and lower demand related
to new product launches. Video conferencing net sales increased 10% in fiscal year 2012 over 2011, primarily
driven by growth in the EMEA and Asia Pacific regions, with strong growth in Russia, China and Australia. Sales
of infrastructure software and hardware grew due to the launch of the LifeSize Bridge and the LifeSize UVC Video
Center in late fiscal year 2011. Foreign currency exchange rates did not affect LifeSize sales.
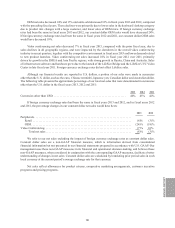
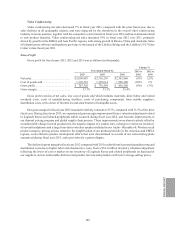
Although our financial results are reported in U.S. dollars, a portion of our sales were made in currencies
other than the U.S. dollar, such as the euro, Chinese renminbi, Japanese yen, Canadian dollar and Australian dollar.
The following table presents the approximate percentage of our total net sales that were denominated in currencies
other than the U.S. dollar in the fiscal years 2013, 2012 and 2011:
2013 2012 2011
Currencies other than USD. . . . . . . . . . . . . . . . . . . . . . . . . . . . . . . . . . . . . . . . . . . . . . . . . . . 46% 45% 42%
If foreign currency exchange rates had been the same in fiscal years 2013 and 2012, and in fiscal years 2012
and 2011, the percentage changes in our constant dollar net sales would have been:
2013 2012
Peripherals . . . . . . . . . . . . . . . . . . . . . . . . . . . . . . . . . . . . . . . . . . . . . . . . . . . . . . . . . . . . . . . . . . .
Retail . . . . . . . . . . . . . . . . . . . . . . . . . . . . . . . . . . . . . . . . . . . . . . . . . . . . . . . . . . . . . . . . . . . . (6)% (3)%
OEM . . . . . . . . . . . . . . . . . . . . . . . . . . . . . . . . . . . . . . . . . . . . . . . . . . . . . . . . . . . . . . . . . . . . . (24)% (18)%
Video Conferencing. . . . . . . . . . . . . . . . . . . . . . . . . . . . . . . . . . . . . . . . . . . . . . . . . . . . . . . . . . . . (7)% 10%
Total net sales . . . . . . . . . . . . . . . . . . . . . . . . . . . . . . . . . . . . . . . . . . . . . . . . . . . . . . . . . . . (8)% (3)%
We refer to our net sales excluding the impact of foreign currency exchange rates as constant dollar sales.
Constant dollar sales are a non-GAAP financial measure, which is information derived from consolidated
financial information but not presented in our financial statements prepared in accordance with U.S. GAAP. Our
management uses these non-GAAP measures in its financial and operational decision-making, and believes these
non-GAAP measures, when considered in conjunction with the corresponding GAAP measures, facilitate a better
understanding of changes in net sales. Constant dollar sales are calculated by translating prior period sales in each
local currency at the current period’s average exchange rate for that currency.
Net sales reflect allowances for product returns, cooperative marketing arrangements, customer incentive
programs and pricing programs.
ANNUAL REPORT
101