Logitech 2013 Annual Report Download - page 105
Download and view the complete annual report
Please find page 105 of the 2013 Logitech annual report below. You can navigate through the pages in the report by either clicking on the pages listed below, or by using the keyword search tool below to find specific information within the annual report.-
 1
1 -
2
-
3
-
4
-
5
-
6
-
7
-
8
-
9
-
10
-
11
-
12
-
13
-
14
-
15
-
16
-
17
-
18
-
19
-
20
-
21
-
22
-
23
-
24
-
25
-
26
-
27
-
28
-
29
-
30
-
31
-
32
-
33
-
34
-
35
-
36
-
37
-
38
-
39
-
40
-
41
-
42
-
43
-
44
-
45
-
46
-
47
-
48
-
49
-
50
-
51
-
52
-
53
-
54
-
55
-
56
-
57
-
58
-
59
-
60
-
61
-
62
-
63
-
64
-
65
-
66
-
67
-
68
-
69
-
70
-
71
-
72
-
73
-
74
-
75
-
76
-
77
-
78
-
79
-
80
-
81
-
82
-
83
-
84
-
85
-
86
-
87
-
88
-
89
-
90
-
91
-
92
-
93
-
94
-
 95
95 -
 96
96 -
 97
97 -
 98
98 -
 99
99 -
 100
100 -
 101
101 -
 102
102 -
 103
103 -
 104
104 -
 105
105 -
 106
106 -
 107
107 -
 108
108 -
 109
109 -
 110
110 -
 111
111 -
 112
112 -
 113
113 -
 114
114 -
 115
115 -
116
-
117
-
118
-
119
-
120
-
121
-
122
-
123
-
124
-
125
-
126
-
127
-
128
-
129
-
130
-
131
-
132
-
133
-
134
-
135
-
136
-
137
-
138
-
139
-
140
-
141
-
142
-
143
-
144
-
145
-
146
-
147
-
148
-
149
-
150
-
151
-
152
-
153
-
154
-
155
-
156
-
157
-
158
-
159
-
160
-
161
-
162
-
163
-
164
-
165
-
166
-
167
-
168
-
169
-
170
-
171
-
172
-
173
-
174
-
175
-
176
-
177
-
178
-
179
-
180
-
181
-
182
-
183
-
184
-
185
-
186
-
187
-
188
-
189
-
190
-
191
-
192
-
193
-
194
-
195
-
196
-
197
-
198
-
199
-
200
-
201
-
202
-
203
-
204
-
205
-
206
-
207
-
208
-
209
-
210
-
211
-
212
-
213
-
214
-
215
-
216
-
217
-
218
-
219
-
220
-
221
-
222
-
223
-
224
 |
 |

Retail sales in the EMEA region experienced a modest 2% decline in fiscal year 2012, compared with the
prior fiscal year, as a result of the uneven economic recovery, particularly in western Europe, and ineffective
regional pricing and channel management programs. This decline was due to significant decreases in our Remotes
and Video categories. These decreases were offset in part by significant increases in our Audio-Wearables &
Wireless and PC Gaming categories. The sales decline during fiscal year 2012 was primarily due to weakness in
Germany, France, Italy, Spain, Norway, Denmark, United Kingdom, Finland, Netherlands, Sweden, Poland and
Belgium, offset in part by increases in Russia, Switzerland, Austria, Turkey and Ukraine. Retail sell-through in the
EMEA region increased 12% in fiscal year 2012 over 2011.
Asia Pacific
Asia Pacific region retail sales decreased by 4% in fiscal year 2013 compared with the prior fiscal year. This
decline was primarily due to decreases in our Other, Remotes, PC Gaming and Video categories. These decreases
were offset in part by a significant increase of 211% in Tablet Accessories and by an increase in Audio-Wearables
& Wireless. Declines by country within the Asia Pacific region were primarily from weakness in India, Australia,
Taiwan and South Korea, offset in part by sales increases in China, New Zealand and Indonesia. Retail sales in
China increased by 4%, led by a significant increase of 391% in Tablet Accessories, and by increases in Audio-
Wearables & Wireless and PC Keyboards & Desktops. These increases in China were offset in part by decreases
in all other categories. China was our third-largest country in terms of net revenue in fiscal year 2013. Retail sell-
through in China increased 14% compared with the prior fiscal year, while retail sell-through in the rest of the Asia
Pacific region decreased 3% during fiscal year 2013.
In fiscal year 2012, Asia Pacific region retail sales increased by 18% compared with fiscal year 2011. This
increase was due to strong performance in all of our retail categories except Remotes and Audio—PC. The Asia
Pacific region also benefited from strong initial demand of our Logitech Ultrathin Keyboard Cover for the iPad,
included in Tablet Accessories. The Asia Pacific region increase was primarily driven by strong sales growth in
China, followed by India, Japan, Taiwan, Indonesia, South Korea, Hong Kong and Malaysia, offset in part by
a significant decrease in Australia. Retail sales in China increased in all product categories in fiscal year 2012
compared with fiscal year 2011, as a result of our increased investment in sales and marketing efforts in the country.
In fiscal year 2012, China was our third largest country in terms of net revenue.
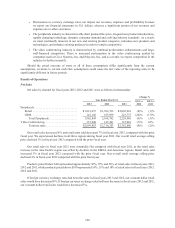
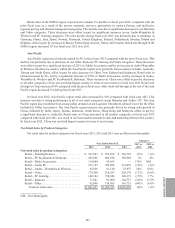
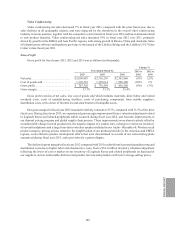
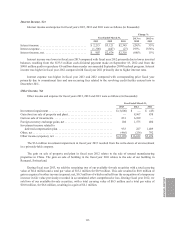
Net Retail Sales by Product Categories
Net retail sales by product categories for fiscal years 2013, 2012 and 2011 were as follows (in thousands):
Year Ended March 31,
Change %
2013 vs
2012
2012 vs
20112013 2012 2011
Net retail sales by product categories:
Retail—Pointing Devices . . . . . . . . . . . . . . . . . $ 521,083 $ 559,366 $ 564,758 (7)% (1)%
Retail—PC Keyboards & Desktops . . . . . . . . . 407,896 404,298 386,968 1% 4%
Retail—Tablet Accessories . . . . . . . . . . . . . . . . 119,804 43,693 — 174% NM
Retail—Audio PC . . . . . . . . . . . . . . . . . . . . . . . 271,197 309,896 318,478 (12)% (3)%
Retail—Audio—Wearables & Wireless . . . . . . 65,826 53,140 23,975 24% 122%
Retail—Video. . . . . . . . . . . . . . . . . . . . . . . . . . . 179,340 216,387 256,170 (17)% (16)%
Retail—PC Gaming. . . . . . . . . . . . . . . . . . . . . . 142,184 170,948 146,373 (17)% 17%
Retail—Remotes . . . . . . . . . . . . . . . . . . . . . . . . 71,641 91,000 144,737 (21)% (37)%
Retail—Other. . . . . . . . . . . . . . . . . . . . . . . . . . . 42,686 134,055 163,751 (68)% (18)%
Total net retail sales . . . . . . . . . . . . . . . . . . . $1,821,657 $1,982,783 $2,005,210 (8)% (1)%
NM—Not Meaningful.
ANNUAL REPORT
103