Logitech 2013 Annual Report Download - page 136
Download and view the complete annual report
Please find page 136 of the 2013 Logitech annual report below. You can navigate through the pages in the report by either clicking on the pages listed below, or by using the keyword search tool below to find specific information within the annual report.-
 1
1 -
2
-
3
-
4
-
5
-
6
-
7
-
8
-
9
-
10
-
11
-
12
-
13
-
14
-
15
-
16
-
17
-
18
-
19
-
20
-
21
-
22
-
23
-
24
-
25
-
26
-
27
-
28
-
29
-
30
-
31
-
32
-
33
-
34
-
35
-
36
-
37
-
38
-
39
-
40
-
41
-
42
-
43
-
44
-
45
-
46
-
47
-
48
-
49
-
50
-
51
-
52
-
53
-
54
-
55
-
56
-
57
-
58
-
59
-
60
-
61
-
62
-
63
-
64
-
65
-
66
-
67
-
68
-
69
-
70
-
71
-
72
-
73
-
74
-
75
-
76
-
77
-
78
-
79
-
80
-
81
-
82
-
83
-
84
-
85
-
86
-
87
-
88
-
89
-
90
-
91
-
92
-
93
-
94
-
95
-
96
-
97
-
98
-
99
-
100
-
101
-
102
-
103
-
104
-
105
-
106
-
107
-
108
-
109
-
110
-
111
-
112
-
113
-
114
-
115
-
116
-
117
-
118
-
119
-
120
-
121
-
122
-
123
-
124
-
125
-
 126
126 -
 127
127 -
 128
128 -
 129
129 -
 130
130 -
 131
131 -
 132
132 -
 133
133 -
 134
134 -
 135
135 -
 136
136 -
 137
137 -
 138
138 -
 139
139 -
 140
140 -
 141
141 -
 142
142 -
 143
143 -
 144
144 -
 145
145 -
 146
146 -
147
-
148
-
149
-
150
-
151
-
152
-
153
-
154
-
155
-
156
-
157
-
158
-
159
-
160
-
161
-
162
-
163
-
164
-
165
-
166
-
167
-
168
-
169
-
170
-
171
-
172
-
173
-
174
-
175
-
176
-
177
-
178
-
179
-
180
-
181
-
182
-
183
-
184
-
185
-
186
-
187
-
188
-
189
-
190
-
191
-
192
-
193
-
194
-
195
-
196
-
197
-
198
-
199
-
200
-
201
-
202
-
203
-
204
-
205
-
206
-
207
-
208
-
209
-
210
-
211
-
212
-
213
-
214
-
215
-
216
-
217
-
218
-
219
-
220
-
221
-
222
-
223
-
224
 |
 |

QUANTITATIVE AND QUALITATIVE DISCLOSURES ABOUT MARKET RISK
Market Risk
Market risk represents the potential for loss due to adverse changes in the fair value of financial instruments.
As a global concern, we face exposure to adverse movements in foreign currency exchange rates and interest rates.
These exposures may change over time as business practices evolve and could have a material adverse impact on
our financial results.
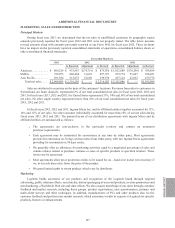
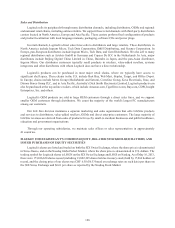
Foreign Currency Exchange Rates
We are exposed to foreign currency exchange rate risk as we transact business in multiple foreign currencies,
including exposure related to anticipated sales, anticipated purchases and assets and liabilities denominated in
currencies other than the U.S. dollar. Logitech transacts business in over 30 currencies worldwide, of which the
most significant to operations are the CNY (Chinese renminbi), Australian dollar, Taiwanese dollar, euro, British
pound, Canadian dollar, Japanese Yen and Mexican Peso. The functional currency of our operations is primarily
the U.S. dollar. To a lesser extent, certain operations use the euro, CNY, Swiss franc, or the local currency of the
country as their functional currencies. Accordingly, unrealized foreign currency gains or losses resulting from the
translation of net assets or liabilities denominated in foreign currencies to the U.S. dollar are accumulated in the
cumulative translation adjustment component of other comprehensive (loss)in shareholders’ equity.
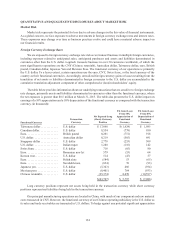
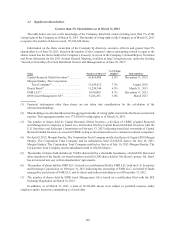
The table below provides information about our underlying transactions that are sensitive to foreign exchange
rate changes, primarily assets and liabilities denominated in currencies other than the functional currency, where
the net exposure is greater than $0.5 million at March 31, 2013. The table also presents the U.S. dollar impact on
earnings of a 10% appreciation and a 10% depreciation of the functional currency as compared with the transaction
currency (in thousands):
Functional Currency
Transaction
Currency
Net Exposed Long
(Short) Currency
Position
FX Gain (Loss)
From 10%
Appreciation of
Functional
Currency
FX Gain (Loss)
From 10%
Depreciation of
Functional
Currency
Taiwanese dollar ............ U.S. dollar $ 17,868 $ (1,624) $ 1,985
Canadian dollar ............. U.S. dollar 8,554 (778) 950
Euro ...................... British pound 8,261 (751) 918
U.S. dollar ................. Australian dollar 6,219 (565) 691
Singapore dollar ............ U.S. dollar 2,778 (253) 309
U.S. dollar ................. Indian rupee 1,280 (116) 142
Swiss franc ................ U.S. dollar 716 (65) 80
Euro ...................... Romanian new lei 579 (53) 64
Korean won ................ U.S. dollar 514 (47) 57
Euro ...................... Polish zloty (584) 53 (65)
Euro ...................... Swedish krona (834) 76 (93)
Japanese yen ............... U.S. dollar (5,343) 486 (594)
Mexican peso .............. U.S. dollar (8,401) 764 (933)
Chinese renminbi ........... U.S. dollar (95,374) 8,670 (10,597)
$(63,767) $ 5,797 $ (7,086)
Long currency positions represent net assets being held in the transaction currency while short currency
positions represent net liabilities being held in the transaction currency.
Our principal manufacturing operations are located in China, with much of our component and raw material
costs transacted in CNY. However, the functional currency of our Chinese operating subsidiary is the U.S. dollar as
its sales and trade receivables are transacted in U.S. dollars. To hedge against any potential significant appreciation
134