Logitech 2013 Annual Report Download - page 121
Download and view the complete annual report
Please find page 121 of the 2013 Logitech annual report below. You can navigate through the pages in the report by either clicking on the pages listed below, or by using the keyword search tool below to find specific information within the annual report.-
 1
1 -
2
-
3
-
4
-
5
-
6
-
7
-
8
-
9
-
10
-
11
-
12
-
13
-
14
-
15
-
16
-
17
-
18
-
19
-
20
-
21
-
22
-
23
-
24
-
25
-
26
-
27
-
28
-
29
-
30
-
31
-
32
-
33
-
34
-
35
-
36
-
37
-
38
-
39
-
40
-
41
-
42
-
43
-
44
-
45
-
46
-
47
-
48
-
49
-
50
-
51
-
52
-
53
-
54
-
55
-
56
-
57
-
58
-
59
-
60
-
61
-
62
-
63
-
64
-
65
-
66
-
67
-
68
-
69
-
70
-
71
-
72
-
73
-
74
-
75
-
76
-
77
-
78
-
79
-
80
-
81
-
82
-
83
-
84
-
85
-
86
-
87
-
88
-
89
-
90
-
91
-
92
-
93
-
94
-
95
-
96
-
97
-
98
-
99
-
100
-
101
-
102
-
103
-
104
-
105
-
106
-
107
-
108
-
109
-
110
-
 111
111 -
 112
112 -
 113
113 -
 114
114 -
 115
115 -
 116
116 -
 117
117 -
 118
118 -
 119
119 -
 120
120 -
 121
121 -
 122
122 -
 123
123 -
 124
124 -
 125
125 -
 126
126 -
 127
127 -
 128
128 -
 129
129 -
 130
130 -
 131
131 -
132
-
133
-
134
-
135
-
136
-
137
-
138
-
139
-
140
-
141
-
142
-
143
-
144
-
145
-
146
-
147
-
148
-
149
-
150
-
151
-
152
-
153
-
154
-
155
-
156
-
157
-
158
-
159
-
160
-
161
-
162
-
163
-
164
-
165
-
166
-
167
-
168
-
169
-
170
-
171
-
172
-
173
-
174
-
175
-
176
-
177
-
178
-
179
-
180
-
181
-
182
-
183
-
184
-
185
-
186
-
187
-
188
-
189
-
190
-
191
-
192
-
193
-
194
-
195
-
196
-
197
-
198
-
199
-
200
-
201
-
202
-
203
-
204
-
205
-
206
-
207
-
208
-
209
-
210
-
211
-
212
-
213
-
214
-
215
-
216
-
217
-
218
-
219
-
220
-
221
-
222
-
223
-
224
 |
 |

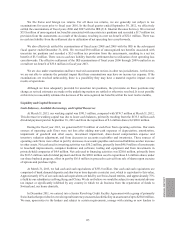
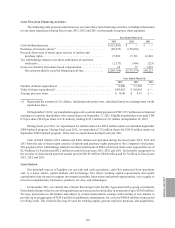
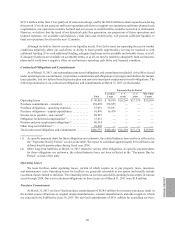
Cash Flow from Financing Activities
The following table presents information on our cash flows from financing activities, including information
on our share repurchases during fiscal years 2013, 2012 and 2011 (in thousands except per share amounts):
Year Ended March 31,
2013 2012 2011
Cash dividend payment . . . . . . . . . . . . . . . . . . . . . . . . . . . . . . . . . . . . . $ (133,462) $ — $—
Purchases of treasury shares(1) . . . . . . . . . . . . . . . . . . . . . . . . . . . . . . . . (89,955) (156,036) —
Proceeds from sales of shares upon exercise of options and
purchase rights . . . . . . . . . . . . . . . . . . . . . . . . . . . . . . . . . . . . . . . . . 15,982 17,591 43,001
Tax withholdings related to net share settlements of restricted
stock units . . . . . . . . . . . . . . . . . . . . . . . . . . . . . . . . . . . . . . . . . . . . . (2,375) (966) (223)
Excess tax benefits from share-based compensation . . . . . . . . . . . . . . . 26 37 3,455
Net cash provided by (used in) financing activities . . . . . . . . . . . . . $(209,784) $(139,374) $46,233
Year Ended March 31,
2013 2012 2011
Number of shares repurchased . . . . . . . . . . . . . . . . . . . . . . . . . . . . . . . . . . . . . 8,600 17,509 —
Value of shares repurchased(1) . . . . . . . . . . . . . . . . . . . . . . . . . . . . . . . . . . . . . . $89,955 $ 156,036 $—
Average price per share . . . . . . . . . . . . . . . . . . . . . . . . . . . . . . . . . . . . . . . . . . $ 10.46 $ 8.91 $—
(1) Represents the amount in U.S. dollars, including transaction costs, calculated based on exchange rates on the
repurchase dates.
On September 5, 2012, our shareholders approved a cash dividend payment of CHF 125.7 million out of retained
earnings to Logitech shareholders who owned shares on September 17, 2012. Eligible shareholders were paid CHF
0.79 per share ($0.85 per share in U.S. dollars), totaling $133.5 million in U.S. dollars on September 18, 2012.
During fiscal year 2013, we repurchased 8.6 million shares for $90.0 million under our amended September
2008 buyback program. During fiscal year 2012, we repurchased 17.5 million shares for $156.0 million under our
September 2008 buyback program. There were no repurchases during fiscal year 2011.
Cash of $16.0 million, $17.6 million and $43.0 million was provided during the fiscal years 2013, 2012 and
2011 from the sale of shares upon exercise of options and purchase rights pursuant to the Company’s stock plans.
The payment of tax withholdings related to net share settlements of RSUs (restricted stock units) required the use of
$2.4 million, $1.0 million and $0.2 million in cash in fiscal years 2013, 2012 and 2011. Tax benefits recognized on
the exercise of share-based payment awards provided $0.03 million, $0.04 million and $3.5 million in fiscal years
2013, 2012 and 2011.
Cash Outlook
Our principal sources of liquidity are our cash and cash equivalents, cash flow generated from operations
and, to a lesser extent, capital markets and borrowings. Our future working capital requirements and capital
expenditures may increase to support investment in product innovations and growth opportunities, or to acquire or
invest in complementary businesses, products, services, and technologies.
In December 2011, we entered into a Senior Revolving Credit Facility Agreement with a group of primarily
Swiss banks that provides for a revolving multicurrency unsecured credit facility in an amount of up to $250.0 million.
We may, upon notice to the lenders and subject to certain requirements, arrange with existing or new lenders to
provide up to an aggregate of $150.0 million in additional commitments, for a total of $400.0 million of unsecured
revolving credit. The credit facility may be used for working capital, general corporate purposes, and acquisitions.
ANNUAL REPORT
119