Logitech 2013 Annual Report Download - page 161
Download and view the complete annual report
Please find page 161 of the 2013 Logitech annual report below. You can navigate through the pages in the report by either clicking on the pages listed below, or by using the keyword search tool below to find specific information within the annual report.-
 1
1 -
2
-
3
-
4
-
5
-
6
-
7
-
8
-
9
-
10
-
11
-
12
-
13
-
14
-
15
-
16
-
17
-
18
-
19
-
20
-
21
-
22
-
23
-
24
-
25
-
26
-
27
-
28
-
29
-
30
-
31
-
32
-
33
-
34
-
35
-
36
-
37
-
38
-
39
-
40
-
41
-
42
-
43
-
44
-
45
-
46
-
47
-
48
-
49
-
50
-
51
-
52
-
53
-
54
-
55
-
56
-
57
-
58
-
59
-
60
-
61
-
62
-
63
-
64
-
65
-
66
-
67
-
68
-
69
-
70
-
71
-
72
-
73
-
74
-
75
-
76
-
77
-
78
-
79
-
80
-
81
-
82
-
83
-
84
-
85
-
86
-
87
-
88
-
89
-
90
-
91
-
92
-
93
-
94
-
95
-
96
-
97
-
98
-
99
-
100
-
101
-
102
-
103
-
104
-
105
-
106
-
107
-
108
-
109
-
110
-
111
-
112
-
113
-
114
-
115
-
116
-
117
-
118
-
119
-
120
-
121
-
122
-
123
-
124
-
125
-
126
-
127
-
128
-
129
-
130
-
131
-
132
-
133
-
134
-
135
-
136
-
137
-
138
-
139
-
140
-
141
-
142
-
143
-
144
-
145
-
146
-
147
-
148
-
149
-
150
-
 151
151 -
 152
152 -
 153
153 -
 154
154 -
 155
155 -
 156
156 -
 157
157 -
 158
158 -
 159
159 -
 160
160 -
 161
161 -
 162
162 -
 163
163 -
 164
164 -
 165
165 -
 166
166 -
 167
167 -
 168
168 -
 169
169 -
 170
170 -
 171
171 -
172
-
173
-
174
-
175
-
176
-
177
-
178
-
179
-
180
-
181
-
182
-
183
-
184
-
185
-
186
-
187
-
188
-
189
-
190
-
191
-
192
-
193
-
194
-
195
-
196
-
197
-
198
-
199
-
200
-
201
-
202
-
203
-
204
-
205
-
206
-
207
-
208
-
209
-
210
-
211
-
212
-
213
-
214
-
215
-
216
-
217
-
218
-
219
-
220
-
221
-
222
-
223
-
224
 |
 |

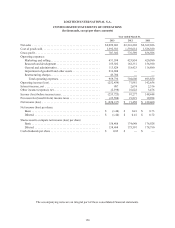
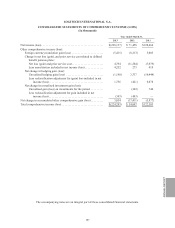
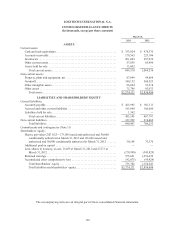
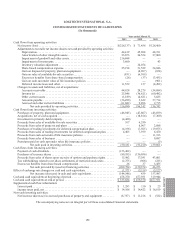
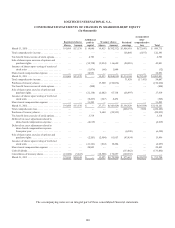
The accompanying notes are an integral part of these consolidated financial statements.
LOGITECH INTERNATIONAL S.A.
CONSOLIDATED STATEMENTS OF CASH FLOWS
(In thousands)
Year ended March 31,
2013 2012 2011
Cash flows from operating activities:
Net income (loss) . . . . . . . . . . . . . . . . . . . . . . . . . . . . . . . . . . . . . . . . . . . . . . . . . . . . $(228,137) $ 71,458 $128,460
Adjustments to reconcile net income (loss) to net cash provided by operating activities:
Depreciation ..................................................... 44,419 45,968 48,191
Amortization of other intangible assets ................................ 23,073 26,534 27,800
Impairment of goodwill and other assets............................... 216,688 — —
Impairment of investments.......................................... 3,600 — 43
Inventory valuation adjustment ...................................... — 34,074 —
Share-based compensation expense................................... 25,198 31,529 34,846
Gain on disposal of property, plant and equipment ....................... — (8,967) (838)
Gain on sales of available-for-sale securities............................ (831) (6,109) —
Excess tax benefits from share-based compensation ..................... (26) (37) (3,455)
Gain on cash surrender value of life insurance policies ................... — — (901)
Deferred income taxes and other ..................................... 11,552 137 (8,492)
Changes in assets and liabilities, net of acquisitions:
Accounts receivable . . . . . . . . . . . . . . . . . . . . . . . . . . . . . . . . . . . . . . . . . . . . . . . 44,928 29,279 (54,684)
Inventories ...................................................... 25,046 (36,621) (60,482)
Other current assets ............................................... (1,189) (4,621) 5,825
Accounts payable ................................................. (36,289) 3,622 37,714
Accrued and other current liabilities . . . . . . . . . . . . . . . . . . . . . . . . . . . . . . . . . . (11,042) 9,896 2,715
Net cash provided by operating activities......................... 116,990 196,142 156,742
Cash flows from investing activities:
Purchases of property, plant and equipment ............................... (46,945) (47,807) (43,039)
Acquisitions, net of cash acquired ....................................... — (18,814) (7,300)
Investment in privately-held company.................................... (4,420) — —
Proceeds from sales of available-for-sale securities ......................... 917 6,550 —
Proceeds from sales of property and plant ................................ — 8,967 2,688
Purchases of trading investments for deferred compensation plan.............. (4,196) (7,505) (19,075)
Proceeds from sales of trading investments for deferred compensation plan...... 4,463 7,399 6,470
Proceeds from cash surrender of life insurance policies...................... — — 11,313
Proceeds from sales of business ........................................ — — 9,087
Premiums paid on cash surrender value life insurance policies ................ — — (5)
Net cash used in investing activities............................. (50,181) (51,210) (39,861)
Cash flows from financing activities:
Payment of cash dividends............................................. (133,462) — —
Purchases of treasury shares ........................................... (89,955) (156,036) —
Proceeds from sales of shares upon exercise of options and purchase rights ...... 15,982 17,591 43,001
Tax withholdings related to net share settlements of restricted stock units ....... (2,375) (966) (223)
Excess tax benefits from share-based compensation ........................ 26 37 3,455
Net cash provided by (used in) financing activities ................. (209,784) (139,374) 46,233
Effect of exchange rate changes on cash and cash equivalents.................... (1,571) (5,119) (5,127)
Net increase (decrease) in cash and cash equivalents................ (144,546) 439 157,987
Cash and cash equivalents at beginning of period ............................. 478,370 477,931 319,944
Cash and cash equivalents at end of period................................... $ 333,824 $ 478,370 $477,931
Supplemental cash flow information:
Interest paid ........................................................ $ 1,293 $ 110 $ 25
Income taxes paid, net . . . . . . . . . . . . . . . . . . . . . . . . . . . . . . . . . . . . . . . . . . . . . . . . $ 14,108 $ 14,422 $ 16,619
Non-cash investing activities:
Net increase (decrease) in accrued purchases of property and equipment ........ (8,737) $ 11,216 $ (522)
ANNUAL REPORT
159