Logitech 2013 Annual Report Download - page 55
Download and view the complete annual report
Please find page 55 of the 2013 Logitech annual report below. You can navigate through the pages in the report by either clicking on the pages listed below, or by using the keyword search tool below to find specific information within the annual report.-
 1
1 -
2
-
3
-
4
-
5
-
6
-
7
-
8
-
9
-
10
-
11
-
12
-
13
-
14
-
15
-
16
-
17
-
18
-
19
-
20
-
21
-
22
-
23
-
24
-
25
-
26
-
27
-
28
-
29
-
30
-
31
-
32
-
33
-
34
-
35
-
36
-
37
-
38
-
39
-
40
-
41
-
42
-
43
-
44
-
 45
45 -
 46
46 -
 47
47 -
 48
48 -
 49
49 -
 50
50 -
 51
51 -
 52
52 -
 53
53 -
 54
54 -
 55
55 -
 56
56 -
 57
57 -
 58
58 -
 59
59 -
 60
60 -
 61
61 -
 62
62 -
 63
63 -
 64
64 -
 65
65 -
66
-
67
-
68
-
69
-
70
-
71
-
72
-
73
-
74
-
75
-
76
-
77
-
78
-
79
-
80
-
81
-
82
-
83
-
84
-
85
-
86
-
87
-
88
-
89
-
90
-
91
-
92
-
93
-
94
-
95
-
96
-
97
-
98
-
99
-
100
-
101
-
102
-
103
-
104
-
105
-
106
-
107
-
108
-
109
-
110
-
111
-
112
-
113
-
114
-
115
-
116
-
117
-
118
-
119
-
120
-
121
-
122
-
123
-
124
-
125
-
126
-
127
-
128
-
129
-
130
-
131
-
132
-
133
-
134
-
135
-
136
-
137
-
138
-
139
-
140
-
141
-
142
-
143
-
144
-
145
-
146
-
147
-
148
-
149
-
150
-
151
-
152
-
153
-
154
-
155
-
156
-
157
-
158
-
159
-
160
-
161
-
162
-
163
-
164
-
165
-
166
-
167
-
168
-
169
-
170
-
171
-
172
-
173
-
174
-
175
-
176
-
177
-
178
-
179
-
180
-
181
-
182
-
183
-
184
-
185
-
186
-
187
-
188
-
189
-
190
-
191
-
192
-
193
-
194
-
195
-
196
-
197
-
198
-
199
-
200
-
201
-
202
-
203
-
204
-
205
-
206
-
207
-
208
-
209
-
210
-
211
-
212
-
213
-
214
-
215
-
216
-
217
-
218
-
219
-
220
-
221
-
222
-
223
-
224
 |
 |

Our executive officers are also eligible to participate in our health and benefits plans, retirement savings
plans, and our employee share purchase plans, which are generally available to our employees. We also provide
limited perquisites, as described in “Other Compensation Elements – Perquisites” below.
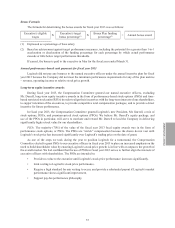
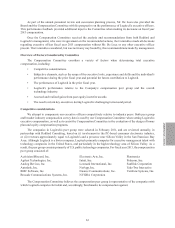
The following table outlines our objectives for each of the principal components of executive compensation.
Element of Compensation Objective
Base salary •Reward individuals for their current contributions to the Company
•Compensate individuals for their expected day-to-day service
Performance-based cash compensation •Align executive compensation with Logitech’s annual
performance goals
•Make a significant portion of the executive’s annual cash
compensation variable and subject to the achievement of Board-
approved, Company-oriented business goals
•Motivate and reward the executive for above-target performance
Long-term equity incentive awards •Deliver the majority of total potential compensation via long-term
equity incentives
•Align executive and shareholder interests
•Provide a direct incentive for future performance
•Support retention of our executive team
Pay Mix
In determining how we allocate an executive’s total compensation package among base salary, performance-
based cash compensation and long-term equity incentives, we emphasize compensation elements that reward
performance against measures that correlate closely with increases in shareholder value. Accordingly, the majority
of our executive compensation is at-risk, including the annual performance-based cash bonus and the majority of
our long-term equity incentive grants. Our CEO and other executive officers have a higher percentage of at-risk
compensation (and thus greater upside potential and downside risk) relative to Logitech’s other employees.
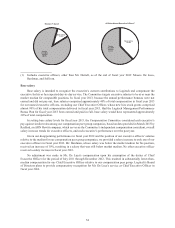
The charts below indicate the percentage of total compensation costs in fiscal year 2013 represented by base
salary, performance-based cash compensation, and long-term equity incentive awards for our Chief Executive
Officer, Bracken Darrell, and for all other named executive officers who remained executive officers through fiscal
year 2013. All underlying amounts are taken from the Summary Compensation Table on page 70.
We design our programs to have the largest portion of potential compensation to be based on long-term
performance (equity), the next largest portion based on short-term performance (annual performance bonus), and
the smallest portion as base salary. While our actual fiscal year 2013 pay mix does not appear to reflect this
design philosophy, with executive officers receiving almost half of their annual compensation in base salary and
the remaining amount of their compensation in equity, it should be noted that, had the fiscal year annual bonuses
been earned, our executive officers would have received one-quarter of their annual compensation in base salary,
one-quarter in annual bonus, and one-half in equity.
PROX Y STATEMENT
53