Logitech 2013 Annual Report Download - page 194
Download and view the complete annual report
Please find page 194 of the 2013 Logitech annual report below. You can navigate through the pages in the report by either clicking on the pages listed below, or by using the keyword search tool below to find specific information within the annual report.-
 1
1 -
2
-
3
-
4
-
5
-
6
-
7
-
8
-
9
-
10
-
11
-
12
-
13
-
14
-
15
-
16
-
17
-
18
-
19
-
20
-
21
-
22
-
23
-
24
-
25
-
26
-
27
-
28
-
29
-
30
-
31
-
32
-
33
-
34
-
35
-
36
-
37
-
38
-
39
-
40
-
41
-
42
-
43
-
44
-
45
-
46
-
47
-
48
-
49
-
50
-
51
-
52
-
53
-
54
-
55
-
56
-
57
-
58
-
59
-
60
-
61
-
62
-
63
-
64
-
65
-
66
-
67
-
68
-
69
-
70
-
71
-
72
-
73
-
74
-
75
-
76
-
77
-
78
-
79
-
80
-
81
-
82
-
83
-
84
-
85
-
86
-
87
-
88
-
89
-
90
-
91
-
92
-
93
-
94
-
95
-
96
-
97
-
98
-
99
-
100
-
101
-
102
-
103
-
104
-
105
-
106
-
107
-
108
-
109
-
110
-
111
-
112
-
113
-
114
-
115
-
116
-
117
-
118
-
119
-
120
-
121
-
122
-
123
-
124
-
125
-
126
-
127
-
128
-
129
-
130
-
131
-
132
-
133
-
134
-
135
-
136
-
137
-
138
-
139
-
140
-
141
-
142
-
143
-
144
-
145
-
146
-
147
-
148
-
149
-
150
-
151
-
152
-
153
-
154
-
155
-
156
-
157
-
158
-
159
-
160
-
161
-
162
-
163
-
164
-
165
-
166
-
167
-
168
-
169
-
170
-
171
-
172
-
173
-
174
-
175
-
176
-
177
-
178
-
179
-
180
-
181
-
182
-
183
-
 184
184 -
 185
185 -
 186
186 -
 187
187 -
 188
188 -
 189
189 -
 190
190 -
 191
191 -
 192
192 -
 193
193 -
 194
194 -
 195
195 -
 196
196 -
 197
197 -
 198
198 -
 199
199 -
 200
200 -
 201
201 -
 202
202 -
 203
203 -
 204
204 -
205
-
206
-
207
-
208
-
209
-
210
-
211
-
212
-
213
-
214
-
215
-
216
-
217
-
218
-
219
-
220
-
221
-
222
-
223
-
224
 |
 |
LOGITECH INTERNATIONAL S.A.
NOTES TO CONSOLIDATED FINANCIAL STATEMENTS (Continued)
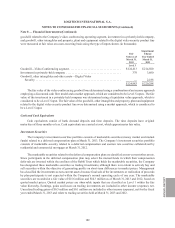
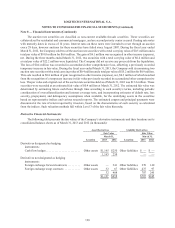
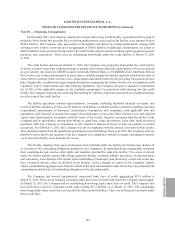
Foreign Exchange Forward and Swap Contracts
The Company also enters into foreign exchange forward contracts to reduce the short-term effects of foreign
currency fluctuations on certain foreign currency receivables or payables. These forward contracts generally
mature within three months. The Company may also enter into foreign exchange swap contracts to economically
extend the terms of its foreign exchange forward contracts. The primary risk managed by using forward and swap
contracts is the foreign currency exchange rate risk. The gains or losses on foreign exchange forward contracts are
recognized in other income (expense), net based on the changes in fair value.
The notional amounts of foreign exchange forward contracts outstanding at March 31, 2013 and 2012 relating
to foreign currency receivables or payables were $14.2 million and $18.7 million. Open forward contracts as of
March 31, 2013 consisted of contracts in U.S. dollars to purchase Taiwanese dollars and contracts in euros to sell
British pounds at future dates at pre-determined exchange rates. Open forward contracts as of March 31, 2012
consisted of contracts in euros to sell British pounds and contracts in Australian dollars to purchase U.S. dollars
at future dates at pre-determined exchange rates. The notional amounts of foreign exchange swap contracts
outstanding at March 31, 2013 and 2012 were $19.6 million and $22.4 million. Swap contracts outstanding at
March 31, 2013 consisted of contracts in Mexican pesos, Japanese Yen and Australian dollars. Swap contracts
outstanding at March 31, 2012 consisted of contracts in Taiwanese dollars, Mexican pesos and Japanese Yen.
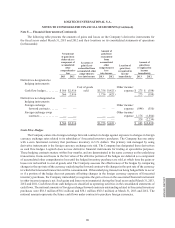
The fair value of all foreign exchange forward contracts and foreign exchange swap contracts is determined
based on observable market transactions of spot currency rates and forward rates. Cash flows from these contracts
are classified as operating activities in the consolidated statements of cash flows.
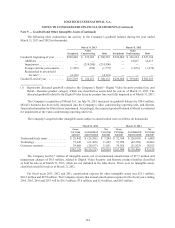
Note 9 — Goodwill and Other Intangible Assets
The Company performs its annual goodwill impairment test of each reporting unit as of December 31 and
completes the assessment during its fiscal fourth quarter, or more frequently, if certain events or circumstances
warrant. Events or changes in circumstances which might indicate potential impairment in goodwill include the
company-specific factors, including, but not limited to, stock price volatility, market capitalization relative to net
book value, and projected revenue, market growth and operating results. Determining the number of reporting
units and the fair value of a reporting unit requires the Company to make judgments and involves the use of
significant estimates and assumptions. The Company has two reporting units: peripherals and video conferencing.
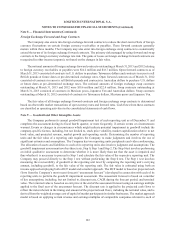
The allocation of assets and liabilities to each of its reporting units also involves judgment and assumptions. The
goodwill impairment assessment involves three tests, Step 0, Step 1 and Step 2. The Step 0 test involves performing
an initial qualitative assessment to determine whether it is more likely than not that the asset is impaired and
thus whether it is necessary to proceed to Step 1 and calculate the fair value of the respective reporting unit. The
Company may proceed directly to the Step 1 test without performing the Step 0 test. The Step 1 test involves
measuring the recoverability of goodwill at the reporting unit level by comparing the reporting unit’s carrying
amount, including goodwill, to the fair value of the reporting unit. The fair value is estimated using both an
income approach employing both a DCF model and a market approach. The DCF model is based on projected cash
flows from the Company’s most recent forecast (‘‘assessment forecast’’) developed in connection with each of its
reporting units to perform the goodwill impairment assessment. The assessment forecast is based on a number
of key assumptions, including, but not limited to, discount rate, CAGR during the forecast period, and terminal
value. The terminal value is based on an exit price at the end of the assessment forecast using an earnings multiple
applied to the final year of the assessment forecast. The discount rate is applied to the projected cash flows to
reflect the risks inherent in the timing and amount of the projected cash flows, including the terminal value, and is
derived from the weighted average cost of capital of market participants in similar businesses. The market approach
model is based on applying certain revenue and earnings multiples of comparable companies relevant to each of
Note 8 — Financial Instruments (Continued)
192